UPFINA's Mission: The pursuit of truth in finance and economics to form an unbiased view of current events in order to understand human action, its causes and effects. Read about us and our mission here.
Reading Time: 5 minutes
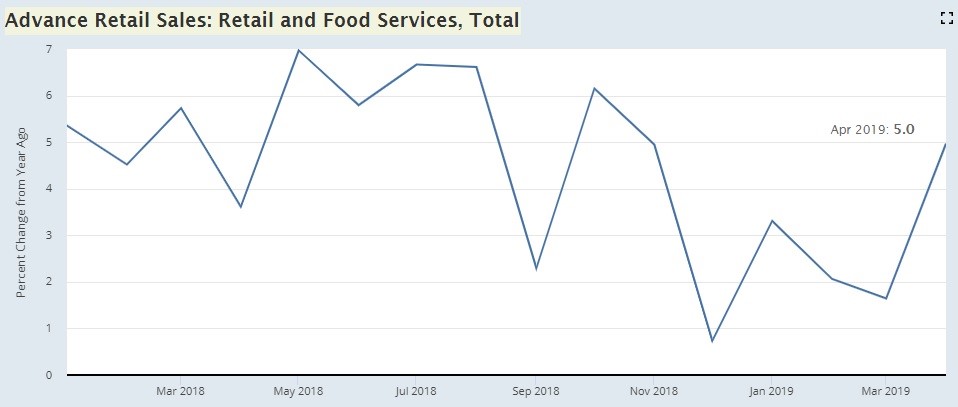
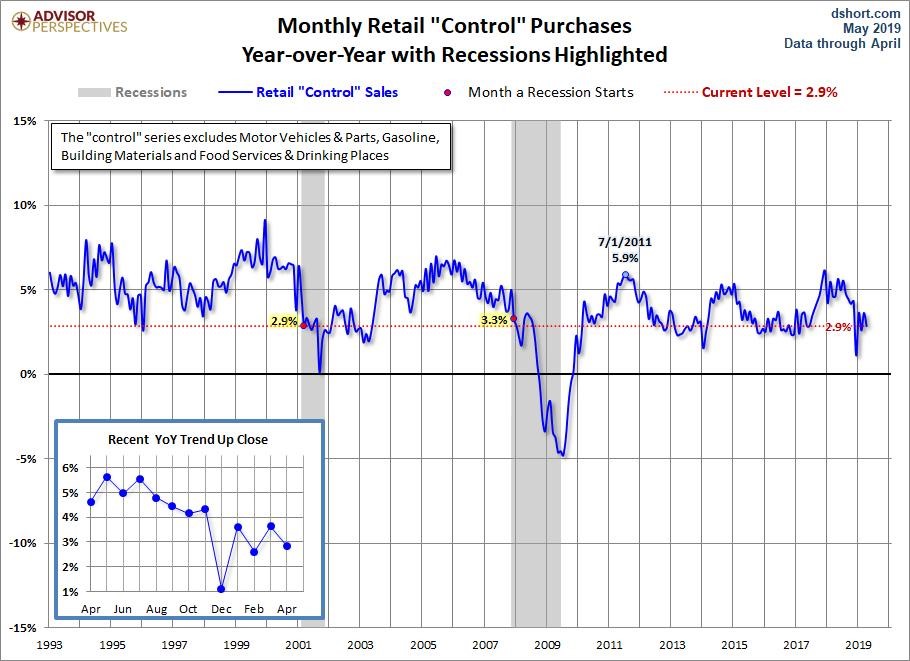
The April seasonally adjusted retail sales report was a major disappointment as headline monthly growth fell from 1.7% to -0.2% which missed estimates for 0.2%. It even missed the low end of the consensus range by 0.1%. Yearly growth was 3.1% which is near the low end of this cycle’s readings but not nearly as bad as the terrible December 2018 report. Ex-autos sales were up 0.1% monthly and 3.3% yearly. This is better than the headline reading because auto sales were weak as they fell 1.1% monthly. Ex-autos and gas sales fell 0.2% which is worse than just ex-autos because gasoline station sales were up 1.8% as they were driven by higher gas prices. The control group’s monthly growth was the only reading that didn’t miss the low end of estimates as it was 0%. It missed the consensus of 0.4% and fell from 1.1% in March. Yearly growth was 2.9%.
Excuses For The Weak Report
One excuse for this weak report was that consumers received lower tax refunds than they may have expected. Lower tax rates mean lower refunds. Consumers often are subject to mental accounting bias which is when they put money in boxes even though it is fungible. This ‘found money’ from a tax refund is often spent right away rather than saved.
The other reason results were poor is the timing of Easter. The holiday was on April 1st last year and April 21st this year. That means there was more spending in March last year and this year had more spending in April. The results are switched during the seasonal adjustment process, but it’s possible that the adjustment went overboard.
To find out more, let’s look at non-adjusted yearly retail sales growth seen in the chart below.
Unsurprisingly, yearly growth was very weak in March as it was 1.6%. It was strong in April as it was 5%. To counteract the effect of seasonal adjustments while accounting for the Easter shift, we can look at March and April’s 2 year unadjusted growth stack. The 2 year growth stack was 7.37% in March; it was 8.58% in April. The eye test, which tells us the jumbled data may have been catalyzed by seasonal adjustments, is correct. The Easter excuse is a valid concern.
Further Retail Sales Details
Because of the 0.1% higher revision in March retail sales, there might be an uplift in the Q1 GDP revision. That revision comes out on May 30th. Q2 GDP growth will be hurt by this April report. This report caused the Atlanta Fed Nowcast’s estimate for real Q2 consumer spending growth to fall from 3.2% to 3%. That was partially why the Q2 GDP growth estimate fell from 1.6% to 1.1% on May 15th.
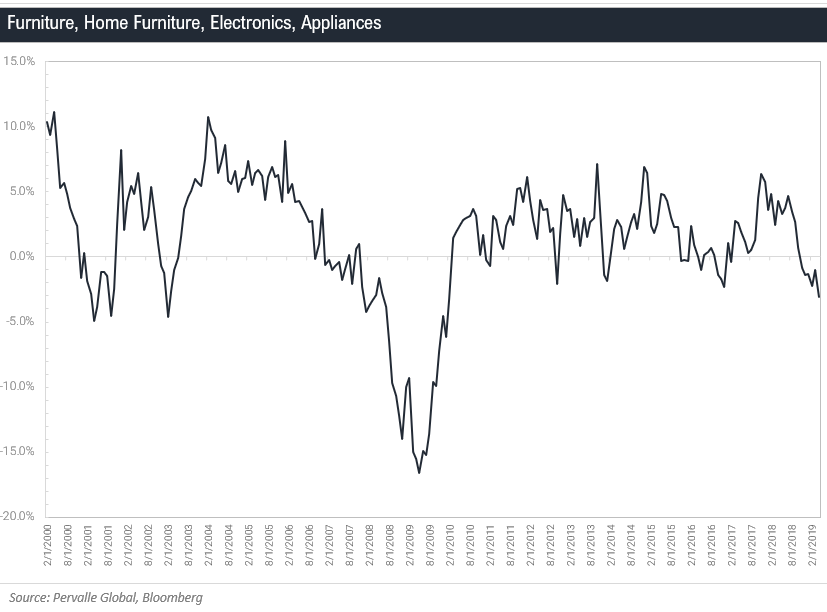
Most of this report shows weakness which isn’t a surprise based on the headline reading. It was hurt by spending on consumer electronics and home improvements. The somewhat weak housing market has a big role to play in latter category’s weakness. The chart below basically takes every weak part of this report and combines it, showing a problematic result. It’s fair to call this cherry picked data, but it’s also fair to say if the economy was strong, spending growth in these categories would be stronger. This group’s growth also was negative last month which had a good headline reading. Specifically, monthly sales at electronics and appliance stores fell 1.3% after falling 4.3%. Furniture sales were flat after falling 3.1%. Building materials sales fell 1.9% after rising 1.2%.
Besides gasoline, there were a couple good parts to this report. Department store sales growth was 0.7% which pushed general merchandise sales growth up to 0.2%. Restaurant sales growth was 0.2% which builds on the 5.7% growth in March. It would have been easy to give some of that gain back.
Q1 Household Debt & Credit Report
In the NY Fed’s Q1 report, total household debt increased from $13.55 trillion to $13.67 trillion. Don’t be fooled by the bearish investors into thinking that household debt being at a record high means the consumer is in trouble. Wealth is also extremely high because of the rise in asset prices like the stock market. For example, total debt increased from $12.68 trillion in Q3 2008 to $13.55 trillion in Q4 2018. In that period, the net worth of households and non-profits increased from $61.689 trillion to $104.329 trillion. That’s a much bigger increase than there was in household debt; the consumer has deleveraged in this expansion, as we have pointed out before.
This cycle has been driven by student and auto loans. They increased from $1.46 trillion and $1.27 trillion to $1.49 trillion and $1.28 trillion. Now let’s look at delinquency rates to check the health of the consumer. The best improvement in the chart below, which shows the percentage of balances 90+ days delinquent, was student loans which fell from 11.4% to 10.9%.
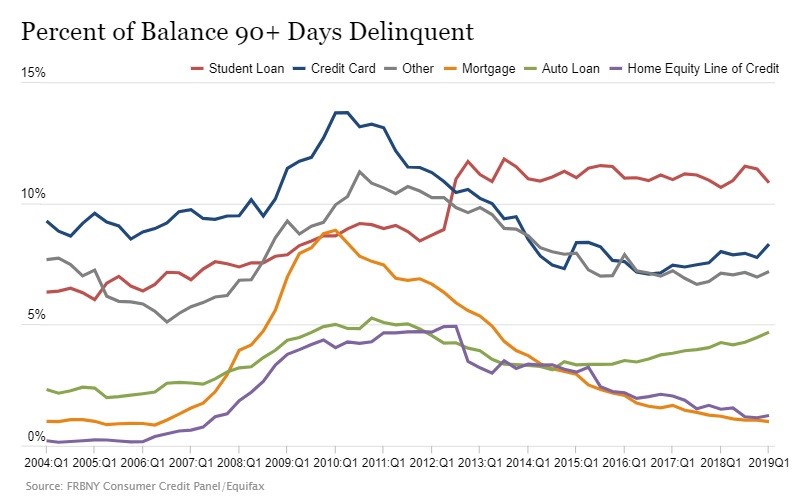
Unfortunately, the percentage of loans in transition to 30+ day and 90+ day delinquency both increased. The 90+ day credit card delinquency rate increased from 7.8% to 8.3% which is the highest rate since Q2 2015. This explains why the net percentage of banks reporting tightening lending standards for credit card loans increased from 6.4% to 15.2%.
The 90+ day delinquency rate on auto loans increased from 4.5% to 4.7% which is the highest rate since Q4 2011. This high delinquency rate is in tune with the weak auto sales we mentioned when discussing the retail sales report. As you can see from the chart below, auto loan growth for borrowers with credit scores below 660 is higher than growth of borrowers with FICO scores above 660.
The lending standards on auto loans are being lowered to make up for weak sales. That will lead to higher delinquency rates.
Conclusion
The April retail sales report was bad as it missed estimates across the board. However, it was hurt by the seasonal adjustment which was made because of the timing of Easter. The consumer deleveraged this cycle. However, issues are creeping up in auto loans and credit card loans. This data is supported by weak auto sales and tightening lending standards for credit cards.
Have comments? Join the conversation on Twitter.
Disclaimer: The content on this site is for general informational and entertainment purposes only and should not be construed as financial advice. You agree that any decision you make will be based upon an independent investigation by a certified professional. Please read full disclaimer and privacy policy before reading any of our content.


