UPFINA's Mission: The pursuit of truth in finance and economics to form an unbiased view of current events in order to understand human action, its causes and effects. Read about us and our mission here.
Reading Time: 5 minutes
In this article, we’ll look at stock market valuations from both a bullish and bearish perspective. Before we look at the stats on the price of the market, let’s review some of the basics of valuation. Price is what you pay for an asset; valuation is what you get. Valuation can be obtained by looking at the price to earnings multiple versus growth estimates, the earnings yield compared to fixed income, or creating a model where you discount forward earnings projections. You look at valuations based on comparisons to firms within the same sector or, if you’re looking at the whole market, the valuations of other countries’ stock markets.
The most critical mistake many investors make is they equate the valuation of a company as a fact instead of an opinion. They see a market or stock, glance at the P/E multiple and say the asset is cheap or expensive. Then they do more in-depth analysis, sometimes coming to the conclusion that the stock is a good buy despite being expensive or it’s a sell despite being cheap. These statements are both oxymoronic because a stock can’t be a good buy if it is expensive. You think a stock is cheap if it is a buy and expensive if it is a sell. The correct phrases would be despite the valuation metric x showing the stock is expensive/cheap I actually think it is a buy/sell based on my own estimates. A stock which has low multiples, but a bad business is known as a value trap, while a stock with high multiples and a good business is known a compounder. You want to sell the value traps and buy the compounders.
Bearish Metrics
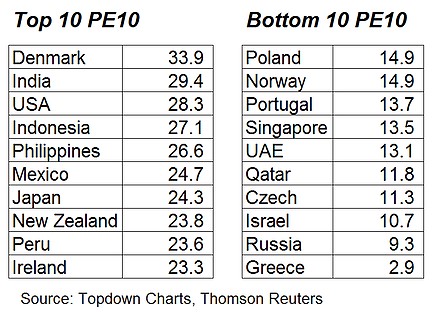
Let’s look at the valuation metrics that show the U.S. market isn’t a good buy at the current levels. Topdown charts lists the markets with the highest PE10s and the lowest PE10s.
The PE10 is the 10-year average earnings multiple. The U.S. has the third highest PE10. America usually has a high multiple because the country is considered economically stable. It would be ridiculous for Greece or Russia to have the same multiple as America as Russia faces economic sanctions and has an economy which is dependent on natural resources like oil and Greece has an economy saddled by debt, a high unemployment rate, and a high number of workers in the underground economy (not paying taxes). India probably has a high PE10 because the country has one of the fastest GDP growth rates in the world. Indian GDP grew 6.1% in Q1 2017 which is considered slow; the slowdown was catalyzed by the lack consumer spending and investment caused by Prime Minister Modi’s demonetization efforts. Demonetization aimed to bring the underground economy above ground (pay taxes).
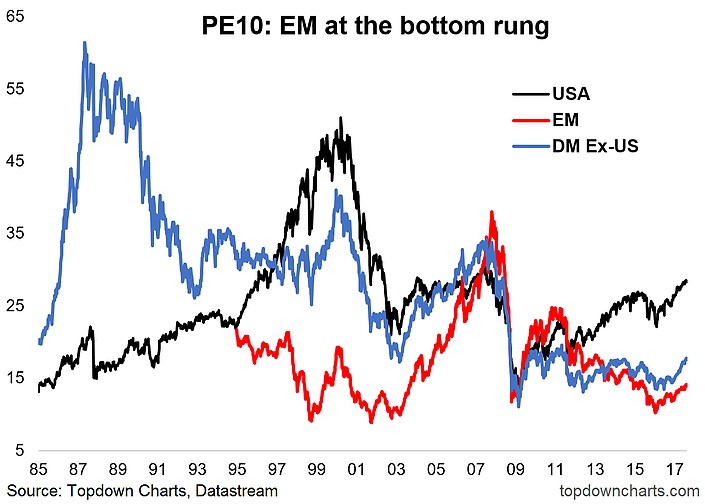
As was mentioned, the U.S. market usually has a higher PE10 than other countries because its capital markets generally have solid accounting and liquidity. The Topdown chart below shows the historical PE10 of the U.S., emerging markets, and the developed markets without the U.S. The emerging markets have a relatively low multiple because the economies have been doing poorly up until this year. Brazil has been mired in political crises and commodities have taken a hit which impacts the emerging markets that are dependent on exporting them, such as Russia. The European and Japanese economy also had tepid growth up until this year which explains their low PE10. The U.S.’s PE10 is near the level before the financial crisis, making it historically high. Notice the new trend which has been starting; global economies outside the US are accelerating. Japanese GDP growth was 1.0% in Q2 2017 which was the fastest growth since Q1 2015. Global trade growth volume is improving, helping emerging market economies. China is investing in infrastructure, boosting its Q2 GDP growth to 6.9%. The best reflection of this new trend this year is that the domestically oriented Russell 2000 is up 1% year to date while the MSCI Emerging Markets index is up 25%. There is still room for developing markets excluding U.S. and emerging markets to play catchup.
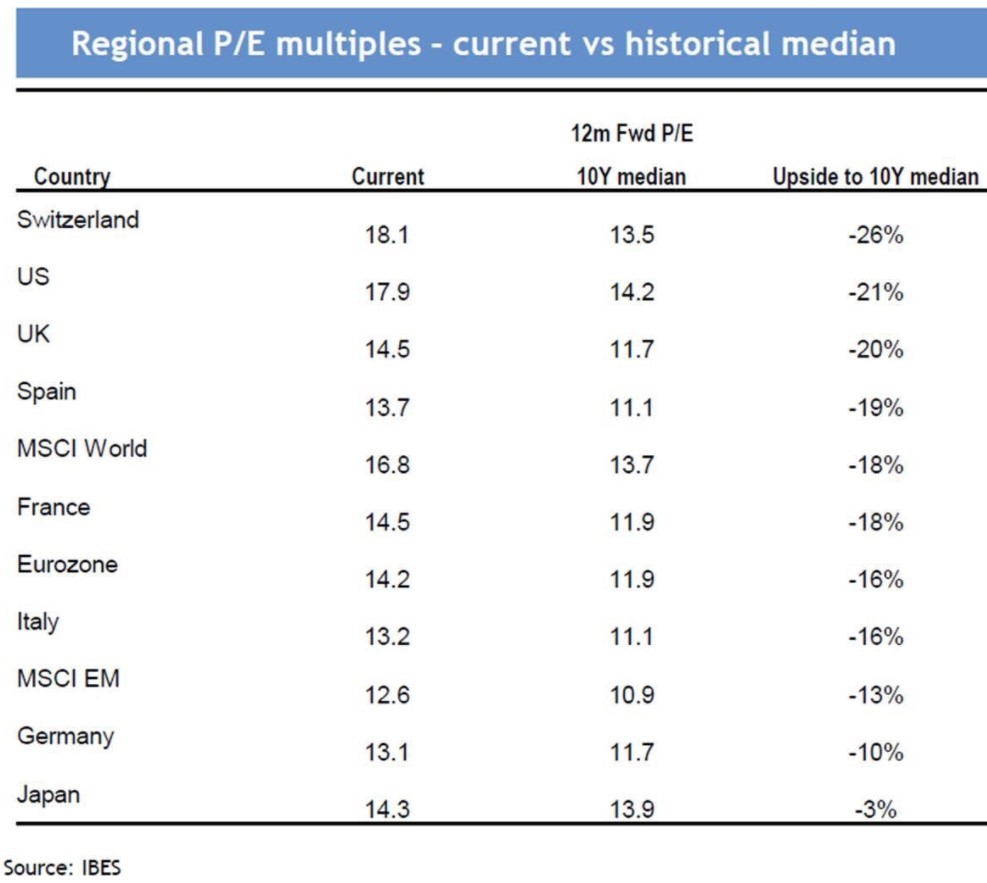
This analysis brings us to the relative valuations chart. The US market’s 12-month forward P/E is 26% higher than the 10-year median 12-month forward P/E. It is one of the most expensive markets relative to historic norm. Japan is very close to its historical median multiple, implying the market may see capital inflows considering the great GDP growth it has recently been able to achieve. 1% growth is a big deal in Japan because it’s population is declining, meaning its GDP per capita growth rate is higher than 1%. In the US, the GDP per capita is lower than its nominal growth rate because it has positive population growth.
Bullish Metrics
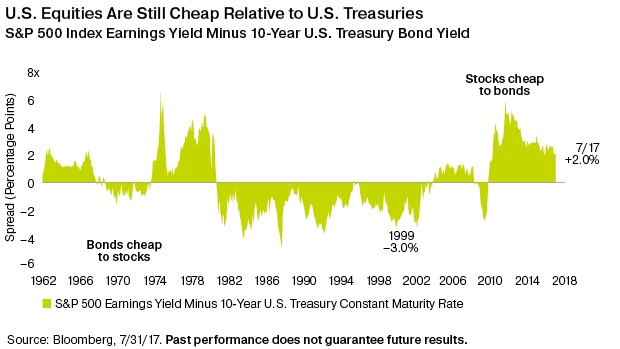
While U.S. stocks have a relatively high multiple compared to other countries, the stock market looks cheap compared to the bond yields. The age-old question in this bull market has been if stocks should be bought because there is no alternative.
Bonds don’t provide much yield, so stocks are looked to as the only other option. This is especially true given the bias against buying real estate after the 2008 collapse. Despite the bears’ arguments, the answer to whether stocks should get a premium multiple in a low interest rate environment is a resounding yes. According to this ratio, stocks are still a better buy than bonds. You can directly compare stocks to bonds by looking at a stock’s earnings yield. The earnings yield is the inverse of the P/E; it is the percentage of each dollar invested in a stock that was earned by the company. This analysis puts a heavy weight on interest rates. If inflation rises, stocks will immediately become expensive. Luckily, inflation, as measured by the CPI, has been tepid in 2017.
Conclusion
If you look at U.S. stocks through the lens of global markets, the market might not be a great place to be because other countries are seeing accelerating GDP growth and have relatively lower multiples. If you look at the stock market relative to the bond market, stocks are a good buy. This may mean U.S. stocks will have a positive next 12 months, but underperform other markets like they have been doing year to date. The Fed wants inflation to justify rate hikes. It wants to raise rates, so it can cut them in the next recession. However, stock investors should be happy to see the Fed was wrong about inflation this year as inflation causes rising bond yields which would be a disaster for stocks.
Have comments? Join the conversation on Twitter.
Disclaimer: The content on this site is for general informational and entertainment purposes only and should not be construed as financial advice. You agree that any decision you make will be based upon an independent investigation by a certified professional. Please read full disclaimer and privacy policy before reading any of our content.


