UPFINA's Mission: The pursuit of truth in finance and economics to form an unbiased view of current events in order to understand human action, its causes and effects. Read about us and our mission here.
Reading Time: 6 minutes
The Federal Reserve has gone through with three rounds of Quantitative Easing programs. There are many opinions about what this policy has done to the economy and stocks. Interestingly conventional wisdom from bullish traders seems hypocritical. During QE 1,2, and 3 which was combined with zero percent interest rates, traders said they bought stocks because they didn’t want to fight to Fed. Now with the Fed raising rates and starting to unwind the balance sheet, the same traders say the Fed has the market’s back. While that might be true, skeptical investors might be wondering what moment the policy won’t support buying stocks. The stock market pumpers won’t tell you when the Fed leaves the market to stand on its own. A good indicator of the Fed’s policy is seen in the chart below. It shows the Fed Funds rate minus the year over year change in core CPI. Core CPI is a measure of inflation which doesn’t include energy and food. As you can see, this cycle has had the longest period of easy policy in history.
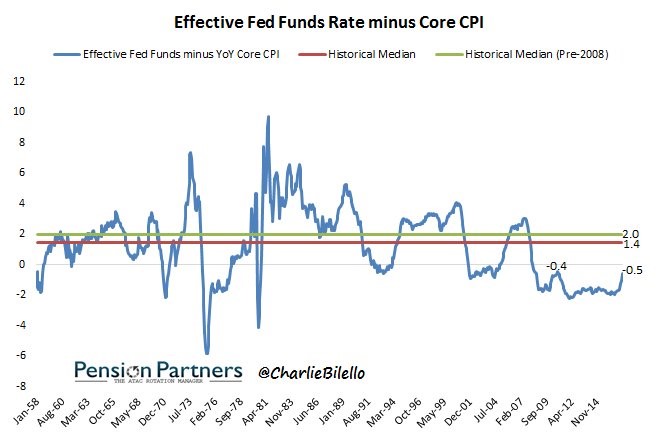
Fed Funds Rate Minus Core CPI
The Fed doesn’t want its rate increases to cause tight financial conditions; it wants to raise rates so it has room to cut them in the next recession. Pension funds are also underperforming with low interest rates because they typically invest in bonds. The Fed would rather take its chances with rate hikes then have to bail out pension funds as that would take unprecedented action. The current set up of the financial system doesn’t work with near zero rates. The relationship between the Fed Funds rate and inflation is why the Fed wants inflation to go up. It mistakenly thinks growth and inflation are linked as if growth can’t occur with low inflation. The chart below is a great depiction of central banks’ effects on the market. It shows the huge bull market in global stocks while inflation has vacillated, ignoring Fed policy. The latest trend of increasing stock prices and improved growth hasn’t come with any inflation which is why the Fed is having problems with raising rates.
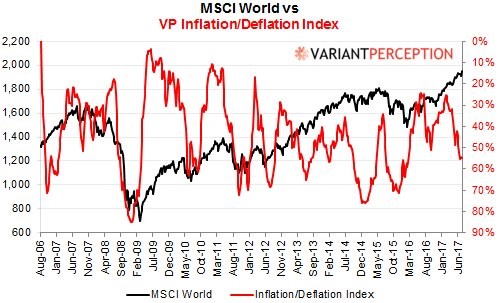
World Stocks Versus Inflation
Looking at the daily picture to get a specific look at what is happening in the market as a result of Fed policy, the chart below shows the stock market’s action on FOMC days which are the days when the Fed announces policy changes and puts out a statement. The data was collected from September 1994 to March 2011. As you can see, it’s usually an up day with some volatility right after the announcement. This year the Fed has come up with a new policy which appears to be a contradiction. The latest policy moves have been dovish rate hikes. Normally, you’d think a rate hike would be hawkish, but the Fed uses dovish language to console the market. It’s like soothing a baby as it gets its necessary shots. The Fed is cognizant of what makes the stock market move, avoiding anything that could spook it. The question is what happens when the Fed becomes tight in the first chart above. The Fed can’t stay dovish forever; with rate hikes and disinflation, it is in a bind.
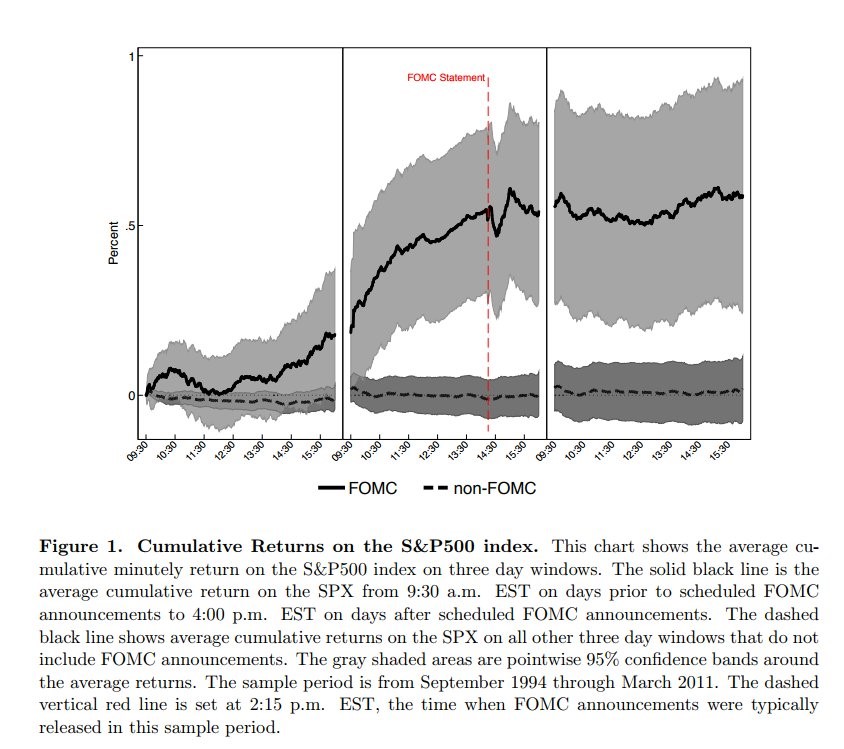
Stocks’ Performance On FOMC Statement Days
Besides the disinflation, the Fed must deal with the chart below. As you can see, the market is about to experience a global round of tapering. In 2019, it’s expected that central bank liquidity will turn negative for the first time since at least 2006. This would be an example of tight conditions which will override the Fed’s ability to appease the market. 2018 will be when the growth starts to fall off a cliff. Without the support of the ECB, junk bond yields will spike which will hurt risky corporations. Part of the reason the labor market is so strong is weak companies are being given a lifeline with low borrowing costs. Each time the global central banks have eased their liquidity injections, stocks prices have stopped rallying. The last bump up occurred without the Fed so some myopic investors claimed the Fed’s balance sheet isn’t related to stock prices. We’ll see for the first time what central banks have done to the economy and stock market in 2018 when their policies fade.
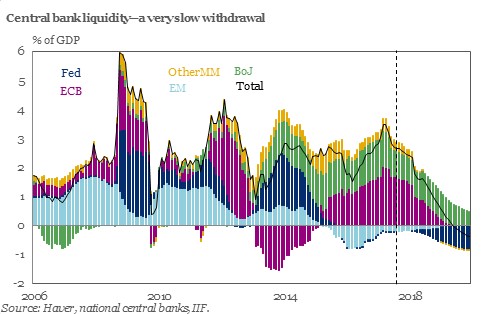
Central Bank Asset Buying
Not only have stocks been mimicking the changes in central bank buying, but also the real estate market has been manipulated. The chart below is St. Joe Company stock. It is a real estate development company. You can see the bumps higher in the stock when global central banks have poured in liquidity. This means the real estate market will also take a hit when central banks pull the plug on QE.
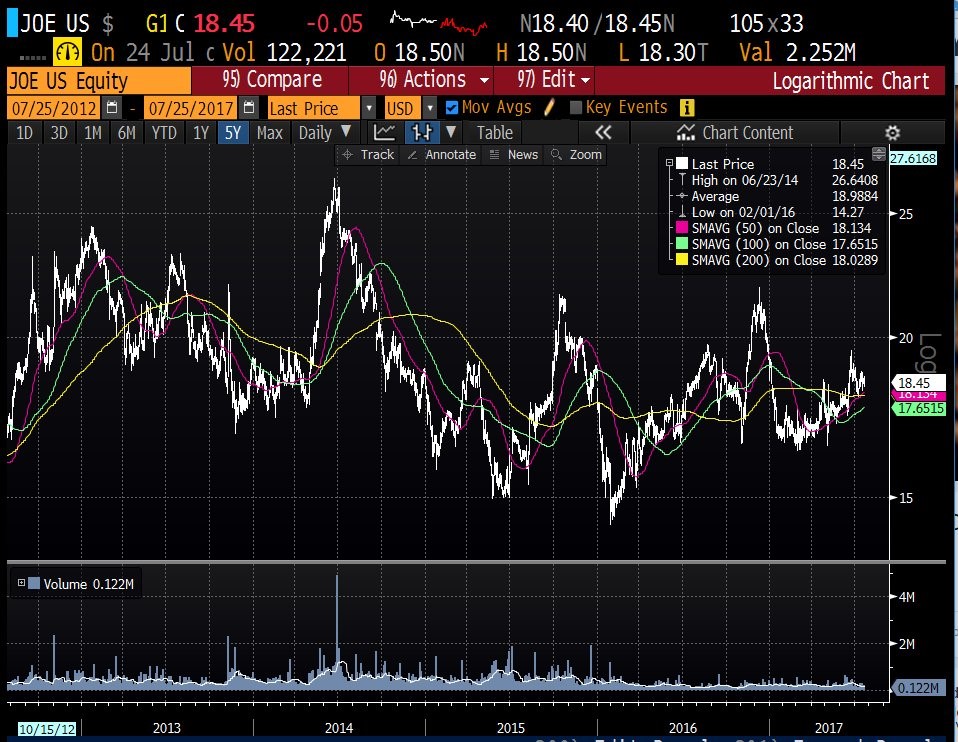
St. Joe Company Stock Price
The final indicator we’ll look at which has moved along with the expansion of central bank balance sheets is the credit impulses of emerging markets. Credit impulses improve when QE is done. You can see the massive improvement in China’s credit impulses in 2009. The Chinese government’s stimulus along QE brought the global economy out of a recession. With China’s economy up to the brim with leverage, it won’t be able to bring the world out of the next crisis. India may be the country to watch next cycle.
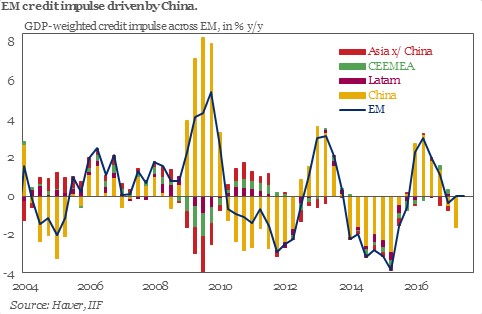
Emerging Market Credit Impulse
As you can see, Chinese credit impulses are already starting to drag even though the QE hasn’t slowed much. Besides that weakness, the economy is experiencing the end of the Capex spending cycle from cyclical firms. The green line showing Capex in the chart below will eventually converge with the grey line which is depreciation and amortization. Capex and D&A must eventually converge because capital expenditures depreciate over time until they’re worthless. Capex that grows faster than D&A forever implies infinite growth as the assets are growing faster than they are depreciated and amortized (which is impossible). It’s interesting to see how the past two declines in Capex led to recessions, but this one hasn’t yet. It still has a few more years to fall as this was the biggest bubble of the three, so there’s time for a recession before the next upturn.
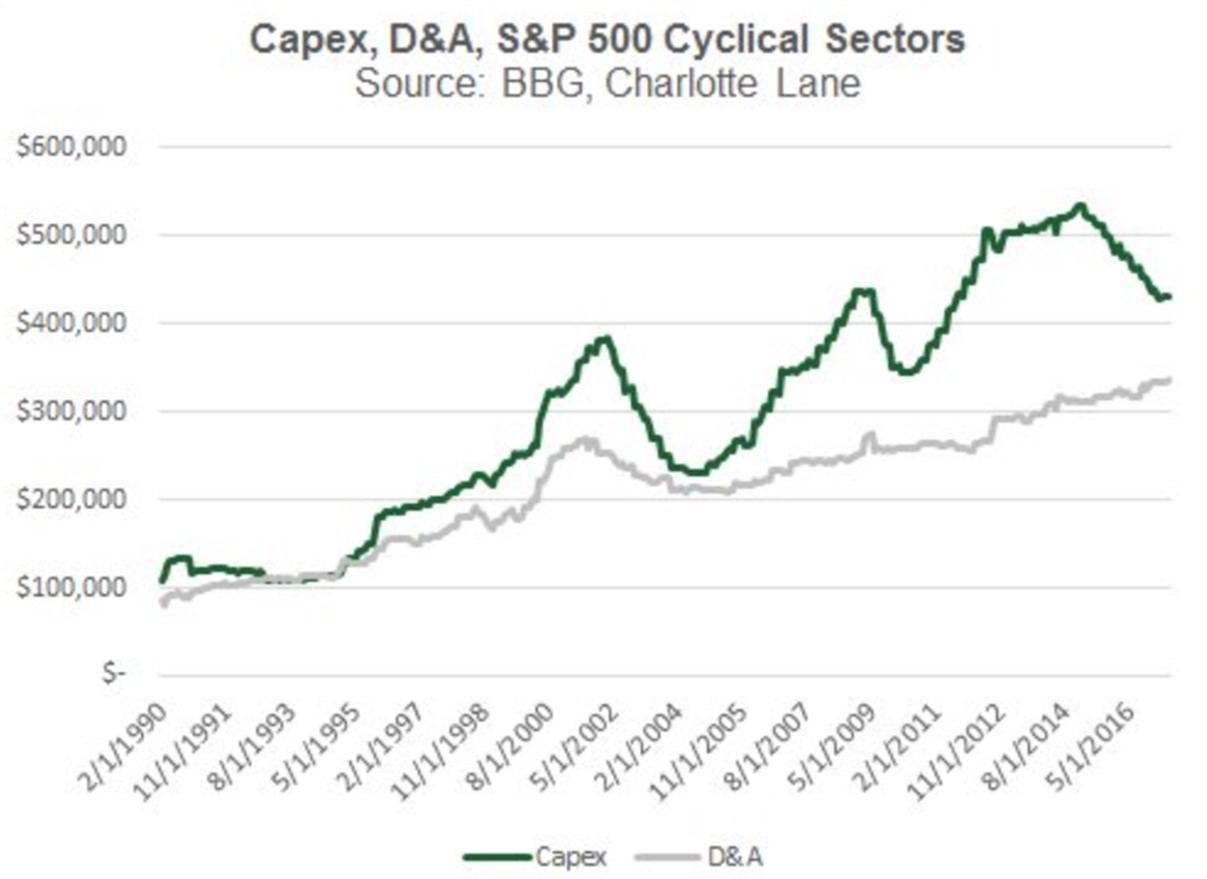
D&A Compared With Capex
Conclusion
Developed countries are experiencing low productivity growth as weak companies are being supported by low interest rates. Pension funds can’t survive with such low interest rates because they aren’t in the stock market. The Federal Reserve also needs to unwind the balance sheet and raise rates so it can cut them and do QE 4 to support the economy in the next recession. This means the Fed is on a path to tighten policy until something breaks. According to the Capex spending, the economy should already be in a recession. The end of dovish policies could bring the economy to its true state which is a recession as the Capex cycle has ended. This means declining stock prices despite the moniker that the Fed has the stock market’s back. When the market realizes the Fed isn’t omnipotent, there will be a sharp correction.
Have comments? Join the conversation on Twitter.
Disclaimer: The content on this site is for general informational and entertainment purposes only and should not be construed as financial advice. You agree that any decision you make will be based upon an independent investigation by a certified professional. Please read full disclaimer and privacy policy before reading any of our content.


