UPFINA's Mission: The pursuit of truth in finance and economics to form an unbiased view of current events in order to understand human action, its causes and effects. Read about us and our mission here.
Reading Time: 6 minutes
Low Volatility In Stocks & Bonds
There are a few ways to sum up 2017. It was the first time in years where the initial earnings estimates ended up being realized. Inflation and wage growth didn’t meet expectations despite the low unemployment rate. Global equities rallied as economic growth improved in emerging markets. The U.S. stock market had a great year despite the political controversies. The Fed finally started its much discussed unwind. It has barely been noticeable, which is the Fed’s plan. The FANG stocks, which are the top tech names, had a great year. These are all valid story lines, but they aren’t the one’s that explain why this is happening. 2017 will be remembered for being one of the least volatile market years ever.
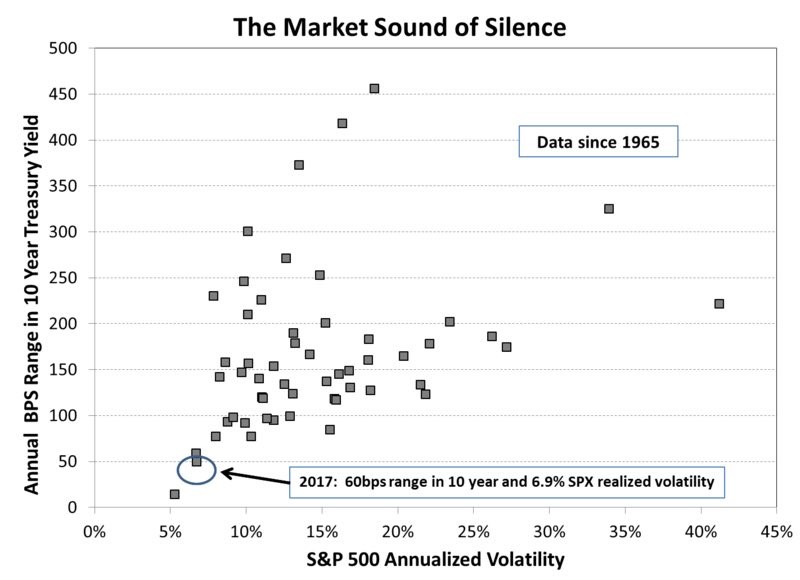
The chart below plots the volatility in stocks and the range of the 10 year treasury yield for each year since 1965.
2017 has the 2nd lowest realized volatility in the S&P 500 and the 2nd lowest range in the 10 year treasury yield. The 10 year Treasury had a 60 basis point range and the S&P 500 had a 6.9% realized volatility. Since 1930, on average, there are 3.4 stock market corrections of 5% per year. There hasn’t been a 5% correction in almost 2 years, meaning the market skipped about six and a half 5% corrections.
Low Volatility Index ETN’s Priced As Though “High Dividend” Investment
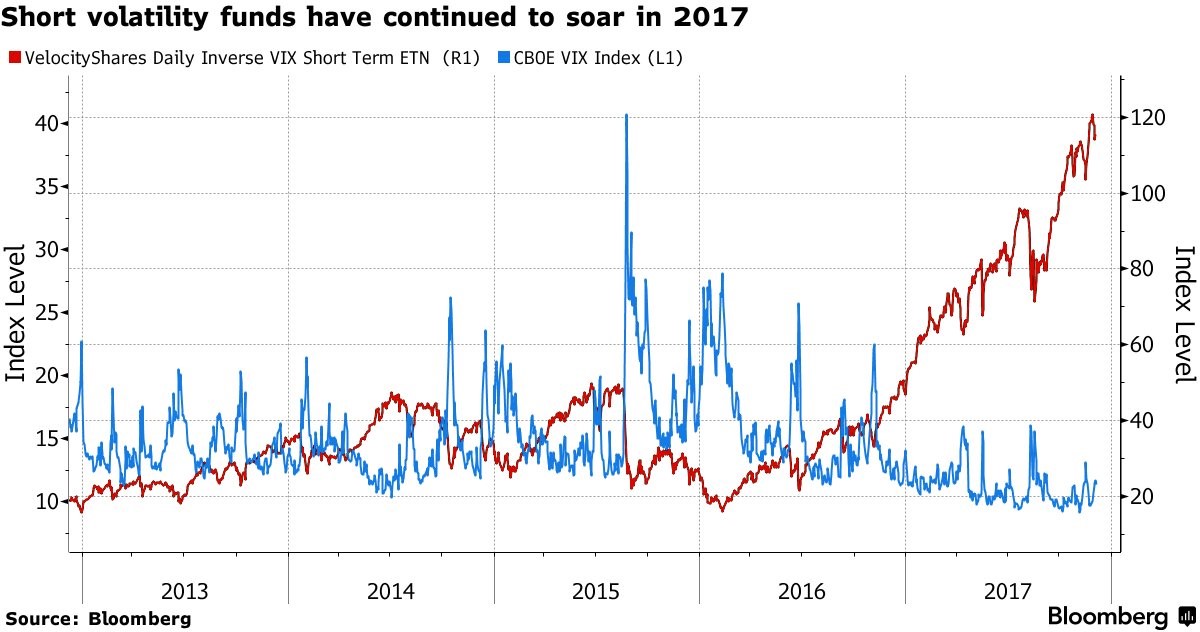
One interesting dynamic has been looking at the VIX as compared with the realized volatility. The Volatility Index ETN’s (VIX) intraday highest print of the year was 17.28; it is the 2nd lowest max in 25 years. The bets against the VIX have exploded in the past year as you can see from the chart below. Betting against the VIX has been the ‘free money’ trade of 2017. If you were to do a statistical analysis, betting against the VIX while it’s near its all-time low makes little sense, but it has worked this year. In this case, buyers of the inverse VIX ETF bought high and just kept buying along with stock investors. There are some bearish investors who are worried about the systemic issues a collapse in the volatility index ETN would bring. Frankly, while a lot of the algorithmic trading is based off the the volatility index ETN, it’d be more concerning the cause of the stock market crash, than the results of the speculative instrument declining.
What Does Low Market Volatility Mean For 2018?
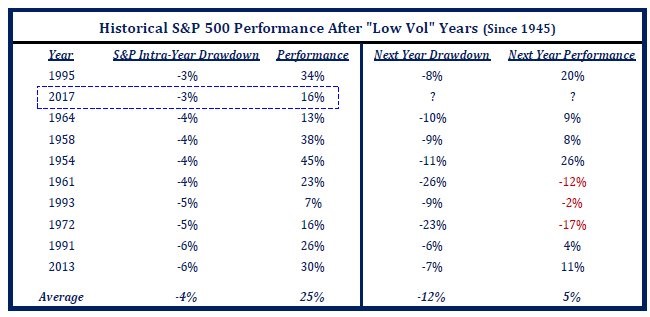
The most obvious question investors are trying to figure out the answer to is what this low market volatility means for 2018’s performance. The table below reviews the years which had the smallest max drawdowns.
1995 had the smallest max drawdown and the lowest max VIX. The average performance of years following low volatility isn’t great as the S&P 500 increases only 5% and the max drawdown average is 12%. The S&P 500’s average return in the past 90 years is 9.8%, so this is a big step down. This doesn’t come close to guaranteeing what 2018 holds. You need to do your usual economic analysis along with individual company research before making any portfolio decisions. This table just aims to give us an idea of what low volatility suggests for the future.
What Is Causing Such Low Volatility?
There is no perfect answer to why volatility is low. Generally, volatility is lower in bull markets than bear markets. The fact that corporate earnings have been strong, GDP growth might be the fastest of this recovery, and inflation is very low make for a good market.
The political issues in 2017 have been dramatic, but they don’t mean much for policy. The 24-hour news cycle exacerbates every single issue which makes it seem like the world is ending. If you are ‘plugged in’ to the online conversations, you can easily lose sight of reality. Some investors have a heightened disdain for the current administration which borders on hysteria. It’s tough to reason with someone who has a blind rage, but the truth is the market hasn’t cared about politics besides the likelihood of the tax cut being passed, which means you should ignore the political excitement as well. There are certain cases where the market is wrong. Investors seeking alpha make their living proving the market wrong. However, with this political situation there’s not much left uncovered. In fact, it leads back to the point that there is a 24 hour news cycle obsessed with everything going on in Washington.
Based on the generally positive environment that has caused stocks to go up more than average and volatility to be relatively quiet, you can make the argument that this low volatility is random. Because of how good this year has been, volatility was probably going to be low; it just so happens to have reached epic proportions.
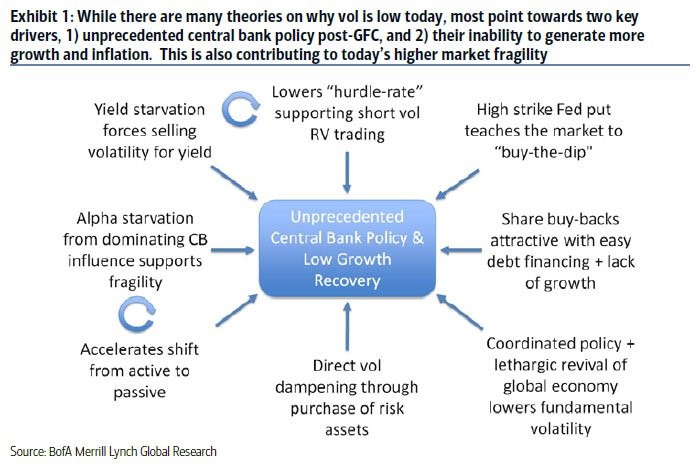
With the randomness argument mentioned, we have another explanation in the slide below from Merrill Lynch.
The slide states central bank quantitative easing and low interest rates have caused market volatility to be low. These arguments are all logical. The need for yield has caused volatility selling. The Fed has tried to back the market during every selloff which makes investors always think they will be saved during a correction. Ultimately, there’s no proof of this argument one way or the other. We’ll get to know the effect of global QE on stocks when the buying slows to a trickle in 2018 and rates are raised. One question which might remain is whether the market thinks the Fed still has its back if it falls. If the only thing holding up this market ends up being a confidence game with the Fed, it would increase the fragility of the market. This is an unknown which seems logical based on speaking with traders.
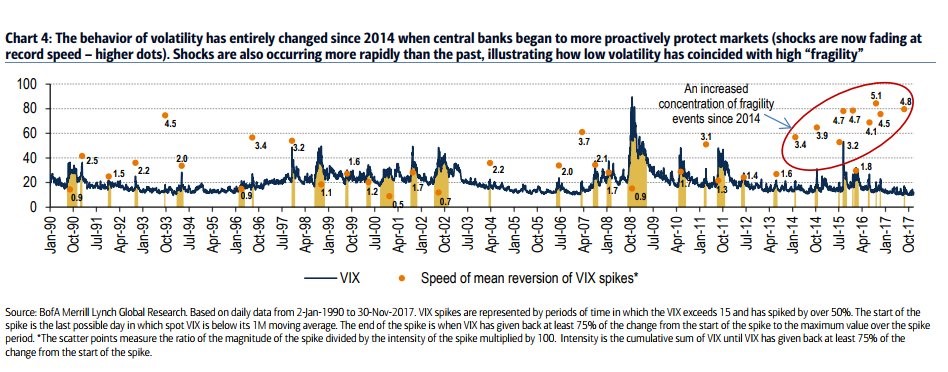
The proof Merrill Lynch provides that the Fed is saving the market is the speed at which the volatility recedes.
The proof that the market is more fragile is that the VIX is increasing more rapidly. One method the Fed uses to calm the market is forward guidance. There might be a less talkative Fed under Powell. Let’s see if that makes a difference on the rate of change of the VIX.
Conclusion
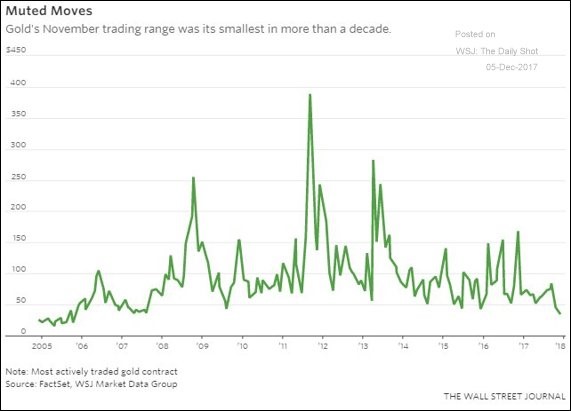
Central bank actions have been unprecedented this cycle. How markets react to what appears to be an increasing possibility of higher volatility may not be an answer we actually want to see in reality. Time will be the ultimate decider for how the greatest monetary experiment unwinds, but what we do know is that markets, like nature, is cyclical. What goes up also comes down, and vice versa. The fact that 2017 witnessed the lowest on record realized volatility should be a warning, not something to become complacent about. With increased volatility, stocks and bonds in theory would experience declines. Even gold has experienced low volatility in 2017. As you can see from the chart below, the November trading range for gold was the lowest in over a decade.
Once again, the most successful long-term portfolio is one that is hedged. The fact that gold witnessed one of the lowest volatility years in more than a decade, may be the biggest bullish indicator yet for the yellow metal.
Have comments? Join the conversation on Twitter.
Disclaimer: The content on this site is for general informational and entertainment purposes only and should not be construed as financial advice. You agree that any decision you make will be based upon an independent investigation by a certified professional. Please read full disclaimer and privacy policy before reading any of our content.

