UPFINA's Mission: The pursuit of truth in finance and economics to form an unbiased view of current events in order to understand human action, its causes and effects. Read about us and our mission here.
Reading Time: 5 minutes
The Economic Cycle Institute, which has been predicting a slowdown in the American economy since late 2017, released their home price leading index which shows similar bearishness. The housing market is the weakest part of the economy. Since American’s primary home is often their largest asset, a decline in prices will have a severe impact on consumer sentiment which is at one of the highest points ever. The chart below shows the leading home price index growth has gone negative. It is showing its worst reading since 2009 when the economy was coming out of the housing bust.
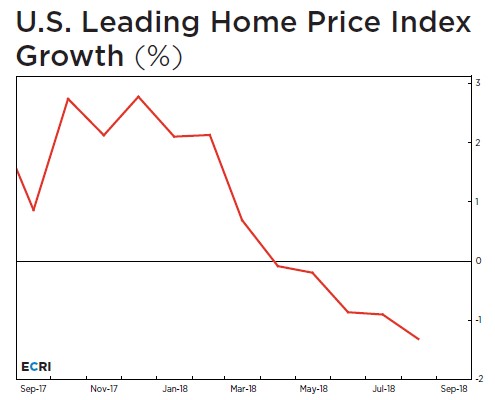
Weakness in the housing market is a red flag for the overall economy because housing generates a huge wealth effect when prices rise and causes consumers to be cautious and save more when prices fall. You might be asking how consumer sentiment is still near its record high if the housing market is so weak. The reality is it isn’t weak yet. The leading indicators signal it’s about to get worse. Being the worst part of the economy doesn’t mean it’s a disaster because the economy is strong. Year over year home prices are still up. The S&P Case Shiller Home Price index is up 6% year over year as of July. Growth recently peaked at 6.5% in March. Based on the more recent data on the housing market, it wouldn’t be a surprise if growth fell further in August and September.
Interest Rates Are A Problem
The lack of home affordability will catalyze the decline in home prices. Barely positive real wage growth this summer doesn’t equate to rapidly rising housing prices. The good news is as housing prices fall, housing will become affordable again. The new problem is interest rates are rising which is making housing even less affordable. As you can see from the FRED chart below, the 30 year fixed mortgage rate increased from 3.85% last year to 4.71%. Rates are the highest since 2011.
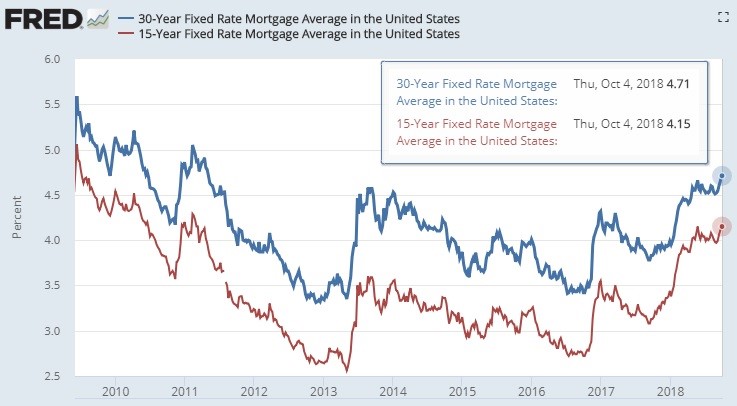
This increase in rates in the past 12 months equates to a 10.7% higher monthly mortgage payment. As you can see below, one way to save money is to take out a 15 year mortgage because you get a lower interest rate and you pay off the house quicker, so interest gets less of a chance to compound. The biggest argument against the recovery in the housing market is low rates supported valuations. If rates get back to the level this expansion started at, prices will fall. It’s terrible to see that the homeownership rate has barely recovered after falling much of this expansion. Rising rates make the challenging situation worse.
Housing Prices Versus Rent
Predicting housing prices isn’t that difficult because home buyers are telling us housing is the least affordable this cycle. This isn’t like the stock market where prices can go however high as speculators take them. If people can’t afford to move, they simply won’t do it. One way to calculate how expensive housing has become is to look at the price of housing in relation to the cost of renting.
The chart below does this by dividing the home price index by the price index for renters’ primary residence.
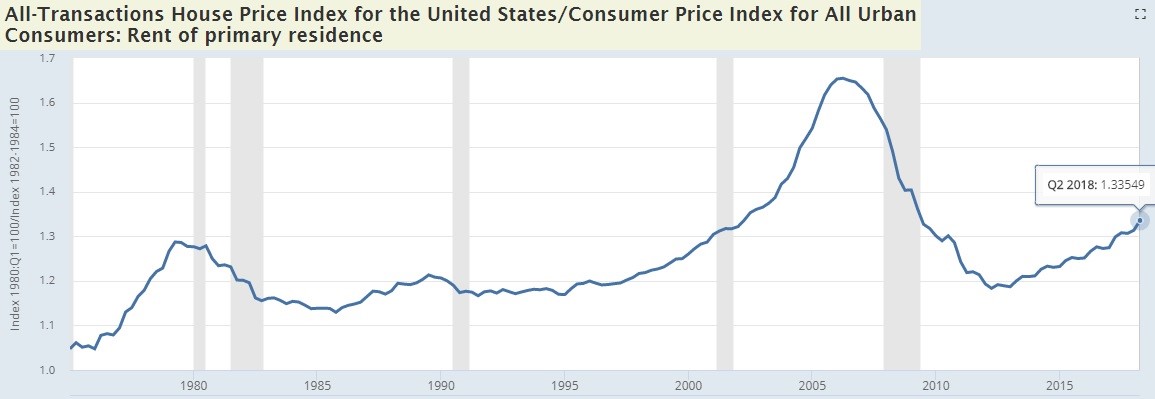
The ratio is at 1.34. In Q2 1979, it peaked at 1.29. Going back to 1975, the only time housing was more expensive in relation to renting was from Q2 2002 to Q2 2009 which is during the housing bubble. While housing overall in the US is not in a bubble (speculative frenzy), it’s possible this ratio is near its peak.
The Latest Housing Data
Although existing home sales don’t add to GDP growth because the house is just changing hands and there is no production, existing homes sales is an important metric because it represents a much larger portion of the housing market than new sales. The chart below shows the recent weakness in existing home sales along with the rise of mortgage rates.

In August, existing home sales were flat on a month over month basis and down 1.5% on a year over year basis. First sales decline and then sellers lower their prices to chase buyers. Year over year sales for single family houses fell 1% and 4.8% for condos. Median prices fell 1.7% month over month to $264,000; they were up 4.3% year over year. The west is the weakest region as sales were down 7.4% year over year. The best region was the south as sales increased 1.8%.
Home Builder Industry Getting Crushed
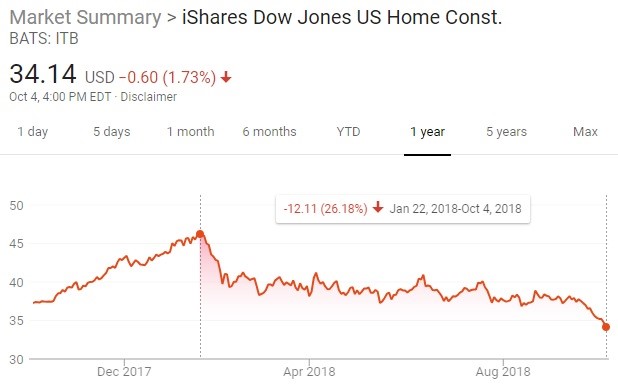
One of the worst industries in the stock market this year is the home builders because sales are down which means supply can’t be increased. There are zoning restrictions on building multi family homes in the areas that need affordable housing the most. Weakness in the housing market is being combined with the tariffs which increase primary metals prices. This raises costs for home builders. As you can see from the chart below, the ITB home builder ETF is down 26.18% from its peak on January 22nd. The S&P 500 is up 3.27% in that period.
No Housing Burst
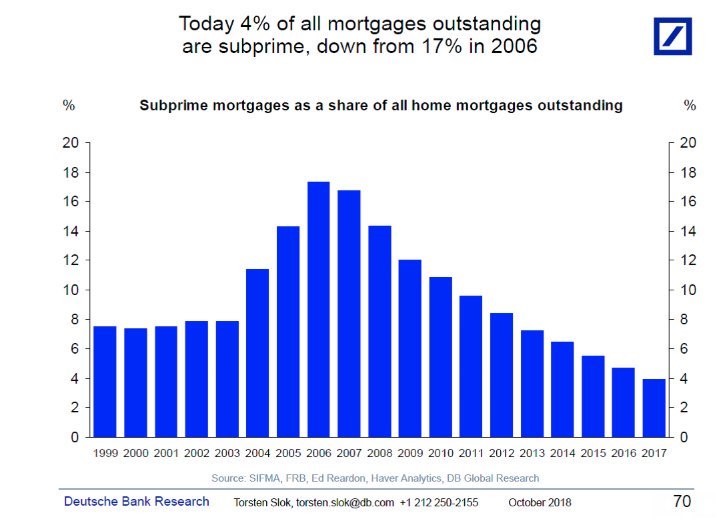
The housing market is weak, but there won’t be another housing bubble burst which collapses the financial system. We’ve discussed how adjustable rate mortgages aren’t prevalent anymore, that borrowers have higher credit scores, and that there are restrictions on the debt to income ratio of buyers which will all prevent another crisis. Another reason there won’t be another crisis is seen below. The chart shows the percentage of mortgages outstanding that are subprime fell from 17% in 2006 to 4% today. Subprime mortgages catalyzed the 2008 crisis.
Conclusion
The economy has a similar set up to 2007 and 2008 in that oil prices are rising and the housing market is weakening. The problems are at a much smaller scale which is why the current potential is for an economic growth slowdown rather than a collapse of the financial system. We will monitor the housing market as prices decline to see if there are any indicators of a recession. Just because prices fall modestly doesn’t mean there will be a recession soon.
Have comments? Join the conversation on Twitter.
Disclaimer: The content on this site is for general informational and entertainment purposes only and should not be construed as financial advice. You agree that any decision you make will be based upon an independent investigation by a certified professional. Please read full disclaimer and privacy policy before reading any of our content.


