UPFINA's Mission: The pursuit of truth in finance and economics to form an unbiased view of current events in order to understand human action, its causes and effects. Read about us and our mission here.
Reading Time: 5 minutes
With Q2 S&P 500 earnings growth at 26.58%, core PCE inflation only at 2%, and small business optimism at the highest level in the 45 year history of the NFIB survey, there’s not much reason to be bearish on equities in the intermediate term. The biggest concern in the next few months is a potential trade war. FactSet determined in its stress test that U.S stocks could lose between 10.83% and 21.88% if there is a trade war. Just because these estimates are precise, doesn’t mean they will be accurate to the nearest hundredths place or even to the nearest percentage point.
Inflation Will End The Cycle: The Question Is When
In this article, we’ll leave out the trade skirmish drama and discuss how close the economy is to the end of this expansion. The baseball analogy where the economy is in a certain inning is overused. It’s better to just go with whether the economy is early cycle, mid cycle, or late cycle. If the labor market is close to being filled, the economy is late cycle. If it has a couple more years of improvement, the economy is mid cycle. Those are the two options.
Inflation usually catalyzes the end of the business cycle. Ever since the August BLS report showed average hourly earnings growth of 2.9% and average weekly earnings growth of 3.2%, the breakeven inflation rate and treasury yields have been increasing.
We will see the effect nominal wage growth had on CPI and PCE in the coming days. If inflation remains modest as expected, real wage growth will accelerate. However, the concern for the economy is when the labor market loses its slack, inflation will have to increase. The situation isn’t problematic for the Fed yet because the curve didn’t flatten after the BLS report. The situation can change in 2019 as wage growth pressure intensifies.
How Full Is The Labor Market?
The labor market isn’t filled as of August because 201,000 jobs were added which is almost double the amount of jobs necessary to keep up with population growth. The key question is when the labor market will become full. That will spell the beginning of the end of the expansion. The prime age labor force participation rate is at 82%. It peaked at 83.4% in the early 2000s expansion and at 84.6% in the 1990s expansion.
The expansions from the 1950s to the early 1980s show a low labor participation rate because less women were in the work force. Even though it seems like the percentages are close, it took one year for the rate to increase from 81.6% to 82%. It could take over 2 years for the rate to reach the previous cycle’s peak. That’s obviously not the only stat which measures the slack in the labor market.
The underemployment rate is 7.4%. It troughed at 7.9% in the last cycle and 6.8% in the 1990s cycle, signaling the labor market is close to full. The chart below shows the labor market has very little slack as the ratio of non-farm job openings to unemployment is at the highest level since the data started being collected in December 2000.

We don’t know for sure what the 1990s cycle would have peaked at, but the data shown above is probably close to the peak because the December 2000 underemployment rate was only 0.1% above the cycle trough.
The left chart below reviews the wage growth data we discussed earlier.
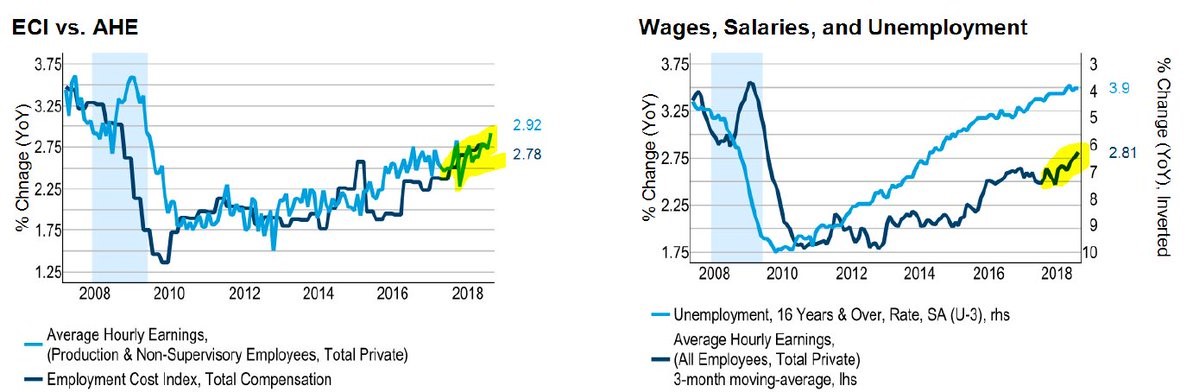
Average hourly earnings growth is the highest since May 2009, meaning it is at a new cycle peak. The employment cost index shows a 2.78% year over year increase which is also a cycle high. Wages and salaries growth hasn’t kept up with the decline in the U3 unemployment rate because of the slack in the labor market created by the last recession. This gap will dissipate as the slack diminishes in the next few quarters. That means wage inflation should accelerate in 2019.
Expansion Models
The Goldman Sachs bull/bear indicator is the most interesting cycle timing metric we’ve seen because it has a great track record and it is signaling the expansion is very close to ending. Even the ECRI leading index, which is down 0.2% year over year, doesn’t signal a recession is coming. It just sees a 2nd half slowdown.
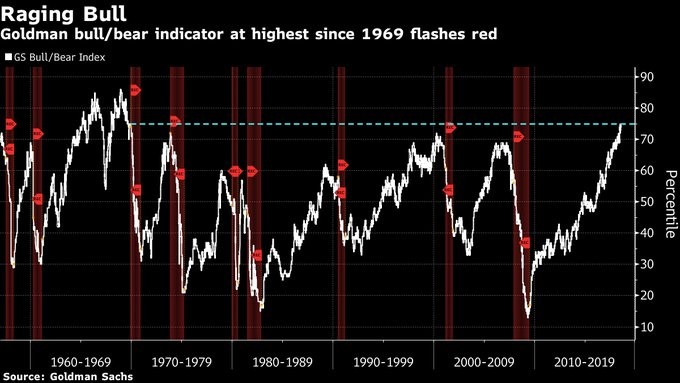
As you can see, the Goldman Sachs metric is at its highest reading since 1969. If you’re betting that the economy won’t hit a recession in the next few quarters, you’re betting this won’t be like the prior 6 cycles. Bulls think it will be like the late 1960s where the indicator had a false peak and there wasn’t a recession until a few years later. This metric includes equity valuations, growth momentum, unemployment, inflation, and the yield curve. It obviously could be wrong, but it’s worth following because of its great track record of predicting recessions.
The charts below show two more updated expansion models which attempt to time recessions.
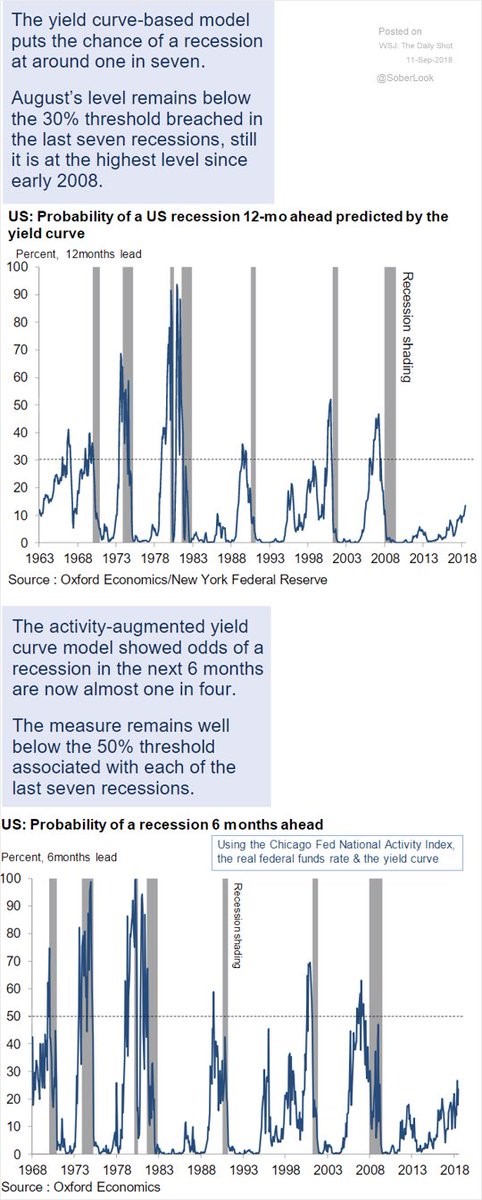
The yield curve based model shows a 1 in 7 chance of a recession in the next 12 months because the yield curve is still normal. Once this model hits 30%, it’s time to get worried. That time isn’t now. The yield curve part of the Goldman Sachs model isn’t the reason it is so high. If the curve inverts, that metric might hit a record high.
The second chart above shows the activity augmented yield curve model predicts there is about a 25% chance of a recession in the next 6 months. The metric uses real rates, the yield curve, and the Chicago Fed activity index. This one needs the 50% threshold to be hit, so it isn’t close either.
Q3 GDP Growth Estimates Fall
The CNBC rapid tracker shows the median Q3 GDP growth estimate has fallen to 3.2%; it includes 12 estimates. The Atlanta Fed table below shows its Nowcast expects 3.8% growth which is down from the peak of 5% on August 1st.
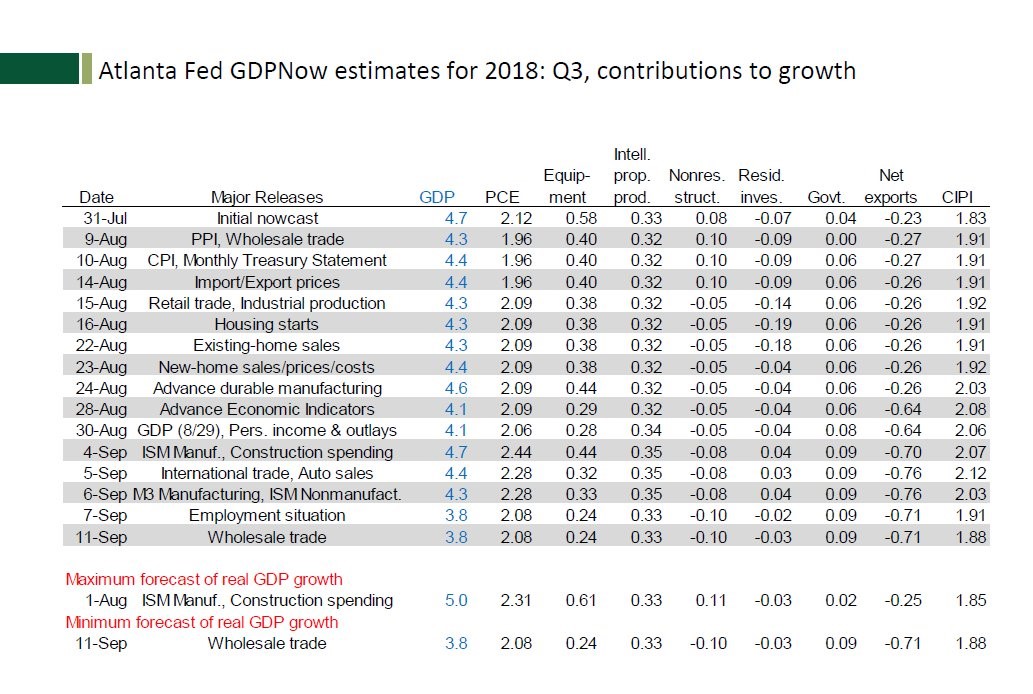
Ultimately, the final reading will be skewed by hurricane Florence, but the goal here is to show recent economic data is pointing to a growth slowdown from the 4.2% rate in Q2.
Conclusion
The labor reports are mixed. Some show the labor market is full now; others say there is enough slack for over 2 more years of growth without excess inflation. Most recession forecasts don’t expect a recession in 2019, but the Goldman Sachs bull/bear reading sees an imminent recession occurring potentially in 2019. GDP forecasts are showing growth slowed recently. The hurricane could push growth lower in Q3 and then rebuilding could push Q4 GDP growth higher. That doesn’t eliminate the overall movement away from rapid growth and towards moderate growth.
Have comments? Join the conversation on Twitter.
Disclaimer: The content on this site is for general informational and entertainment purposes only and should not be construed as financial advice. You agree that any decision you make will be based upon an independent investigation by a certified professional. Please read full disclaimer and privacy policy before reading any of our content.


