UPFINA's Mission: The pursuit of truth in finance and economics to form an unbiased view of current events in order to understand human action, its causes and effects. Read about us and our mission here.
Reading Time: 5 minutes
Treasury yields soared on Wednesday October 3rd as the 10 year bond had its biggest yield spike since November 2016 (the day of Trump’s election and the following day). That’s quite a comparison since there is nothing close to a presidential election happening in October 2018. Yields are increasing because of heightened growth and inflation expectations. As of Thursday, October 4th, the 10 year yield was at 3.20%.
The catalysts for higher inflation estimates are increasing wage growth and higher oil prices. WTI oil hit the highest level since November 2014 as it now has a $76 handle. We will see if wage growth accelerates in the Friday September BLS report. All signs are pointing towards more nominal wage growth. The expectation is for another reading of 2.9% growth which is the same growth in August, which catalyzed this recent spike in yields.
Stocks Rally, But The Banks Underperform Despite Steepening Curve
Higher yields have proven to not be much of a problem for stocks as the S&P 500 is near its record high. The increase in the 10 year yield is great news for those hoping this expansion will last longer because the short end of the curve hasn’t seen as much increases, meaning the curve has steepened. As of Thursday, the 2 year yield was at 2.88%, meaning the difference between the 10 and 2 year yield is 32 basis points. That’s a major increase from the recent bottom of 18 basis points on August 27th.
One interesting dynamic is that even though yields are up and the curve has steepened, the financial sector in the S&P 500 has been underperforming. Since August 27th, the XLF is down 2.34%. In the past 6 months, it’s up 1.19% which is much worse than the S&P 500 which is up 10.54% in the past 6 months and 0.92% since August 27th. There could be a battle between financial stock investors and treasury investors. It’s possible there was panic selling in the long bond. The other potential is another catalyst is weighing on the banks more than yields are helping them.
Highest ISM PMI Since 1997
It’s always difficult to understand the day to day action in markets because there is often irrational action. There can be inconsistent headlines such as those claiming stocks fell because of higher yields which are then switched to saying stocks rallied despite higher yields after they increase. If you follow the headlines which explain why stocks and other markets moved the way they did, you will find inconsistencies almost every day.
On the other hand, we still need to review the data that came out on Wednesday to get a glimpse of why the bond market had such a drastic selloff on a seemingly normal day with no major news. The biggest report on Wednesday was the ISM non-manufacturing PMI. As you can see from the chart below, it came in at 61.6 which was the second highest reading ever.
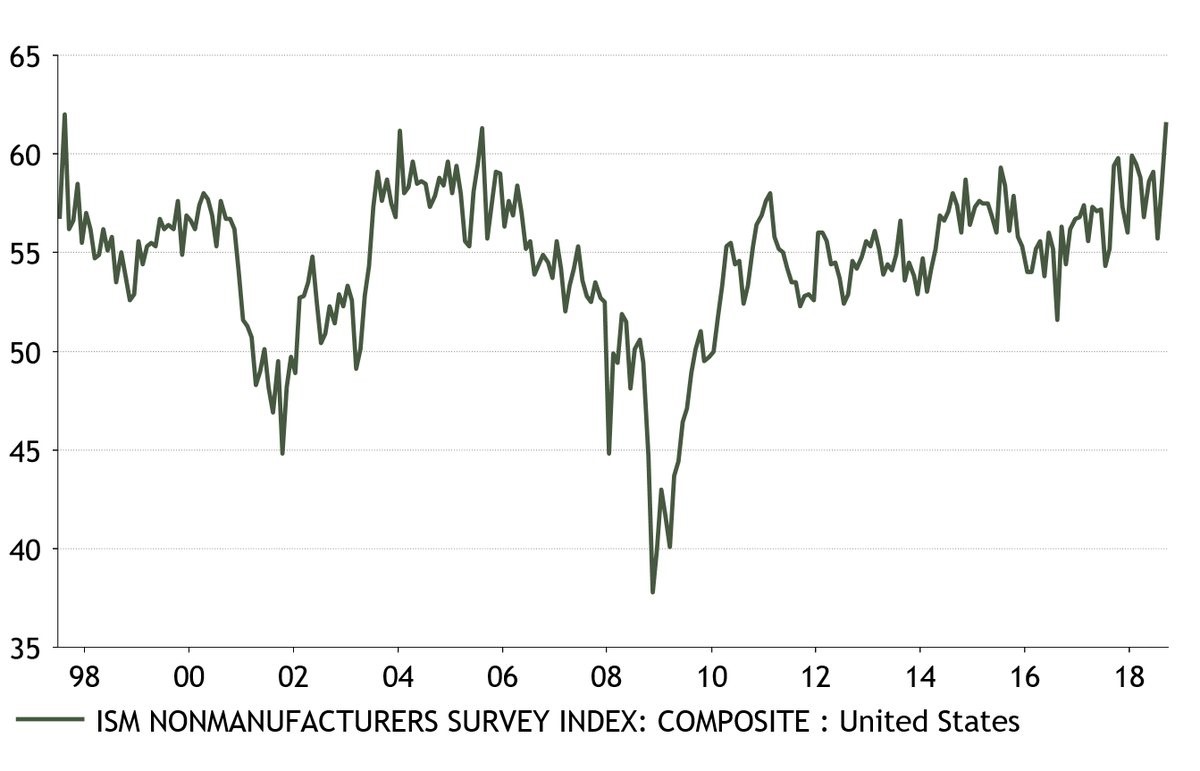
It was the highest PMI since 1997. 65 economists made predictions for this report; the highest one was 59.6, meaning this report beat them all. It was a 5 standard deviation beat.
The details of the report were perfect as the new orders index was up 1.2 to 61.6. The imports reading was up 3 points to 55, signaling domestic demand is strong. As you can see from the chart below, the employment index was up 5.7 points to 62.4. This was the best reading ever.
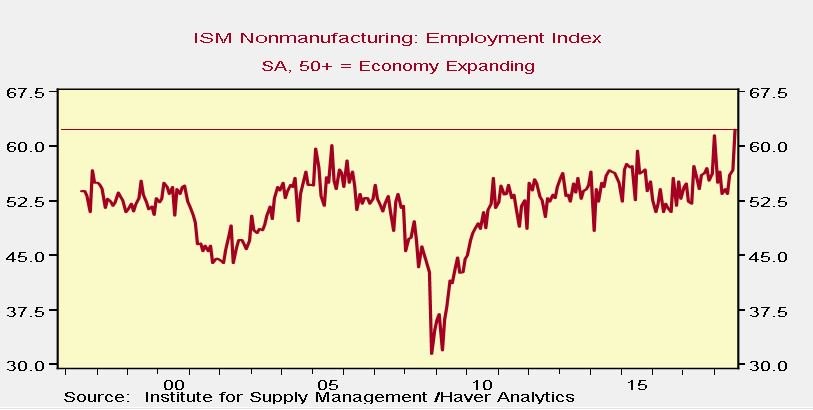
It’s debatable if the labor market is the best since at least 1997. The jobless claims back that up, but the prime age labor force participation rate is still below the past two peaks. Hourly wage growth is at a cycle high, but real wage growth was barely positive in August. It’s interesting to see that even though businesses were quoted as complaining about the tariffs, they were optimistic. The price index was up 1.4 to 64.2 which is a modest pickup to an already hot reading.
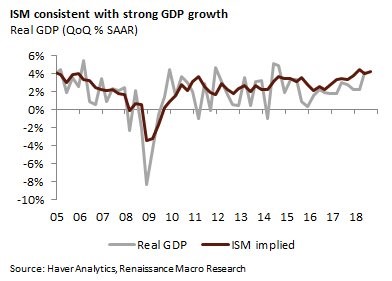
The hot topic this report brings out is if the soft data survey reports are diverging further away from the hard data. Ultimately, it doesn’t matter if the PMI is strong if real GDP growth isn’t great. As you can see from the chart below, real GDP growth has recently been below the ISM implied growth rate. This September PMI implies Q3 GDP growth will be 4.6% which is highly unlikely to occur as the CNBC rapid update shows the average and median forecast out of 13 estimates is for 3.2% growth.
Unspectacular Markit Services Report
It’s amazing to see bonds follow the ISM report and discount the Markit report. As you can see from the first chart below, the Markit services PMI hit an 8 month low.
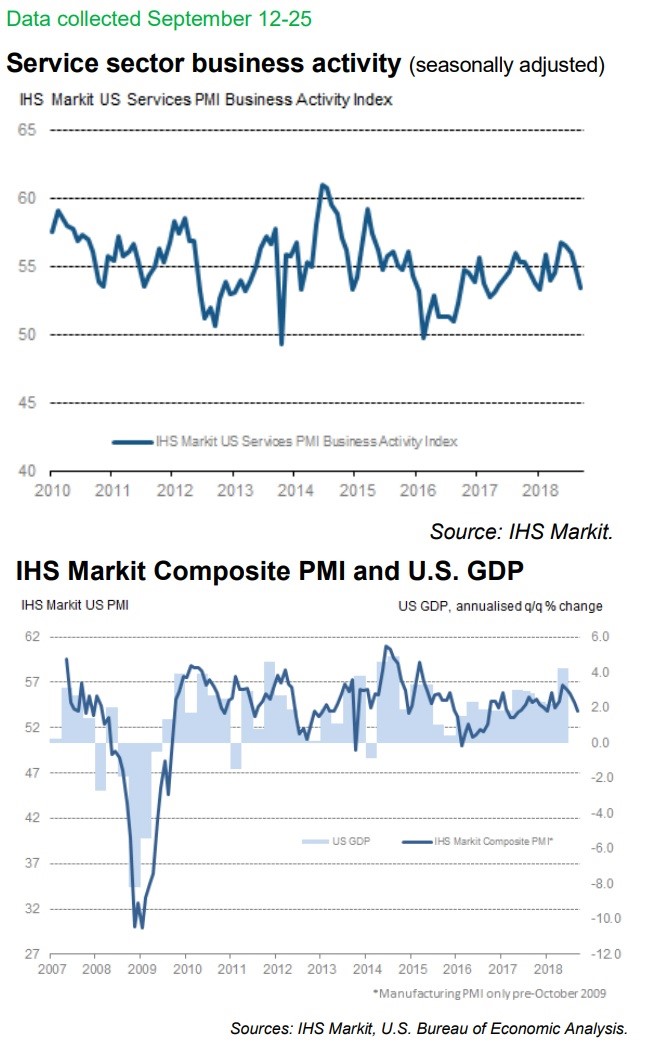
The reading of 53.5 is consistent with just below 3% GDP growth and above 200,000 non-farm jobs created per month. The prices index hit a record high and the job creation index was the fastest since June 2014. The bottom chart shows this report has recently been a bit too pessimistic which means the truth might be in between the Markit and ISM reports. Keep in mind, this Markit reading wasn’t bad; it just wasn’t the best in 21 years like the ISM report.
Strong ADP Report
The final major report on Wednesday was the ADP private sector employment report. As you can see from the chart below, 230,000 jobs were created which beat estimates for 179,000 jobs.

The ADP hasn’t always been accurate in predicting the BLS report, especially recently. However, it’s still good news on the labor market. The bond market doesn’t need much to selloff, so this report just added to the narrative that high nominal wage growth is coming.
Conclusion
There is no telling where Treasury yields are going in the next few weeks because markets can act irrationally in the short term. The selloff in the long bond is being driven by increasing oil prices and expectations for higher nominal wage growth. Looking at the fundamentals, it seems prudent to ignore the idea that the labor market is the best since at least 1997. The ISM survey reports have been overly optimistic for a while. This non-manufacturing report is the best example of that.
Have comments? Join the conversation on Twitter.
Disclaimer: The content on this site is for general informational and entertainment purposes only and should not be construed as financial advice. You agree that any decision you make will be based upon an independent investigation by a certified professional. Please read full disclaimer and privacy policy before reading any of our content.


