UPFINA's Mission: The pursuit of truth in finance and economics to form an unbiased view of current events in order to understand human action, its causes and effects. Read about us and our mission here.
Reading Time: 5 minutes
Recency bias is causing many investors and economists to believe we are in a new era of uncertainty because of the dot com bubble and the 2008 financial crisis. It’s like saying inflation would always stay high after the bout of inflation caused by monetary policy mistakes in the late 1970s and early 1980s. Analyze the current situation and make predictions based on the updated fundamentals. You can’t use a past template for future results when so much has changed.
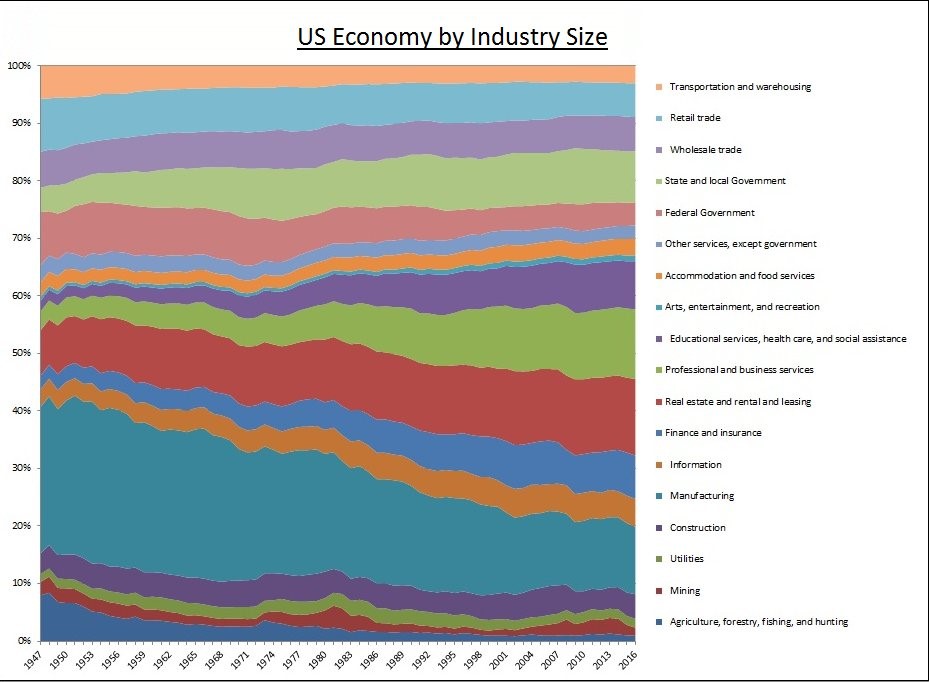
One big difference in the economy which may make it more stable is its diversification. The influence the top stocks have on the overall market is often discussed, but it’s rare to see analysis on the historical change in the economic share of each industry. As you can see from the chart below, the manufacturing sector dominated in the 1940s and 1950s.

While it’s common to hear fears about the demise of manufacturing, we don’t hear about how each industry is more equal which means the overall economy is able to deal with weakness in one industry more easily. It’s a great talking point to say America doesn’t make anything anymore because it spreads fear, but improvement in other industries means shocks in an industry won’t cause the economy to spiral into a recession. It’s easy to see this lack of diversification play out in emerging markets which often have a large portion of the economy tied to natural resource exports. The best recent example of the American economy avoiding a recession because it is diversified is the weakness in manufacturing and oil prices from late 2014 to early 2016 not causing the economy to crash like it did in Brazil and Russia.
Conference Board Shows Extreme Optimism
The August Conference Board consumer confidence report was a shocker in many ways. Firstly, it was the best report since October 2000 which was the height of the tech bubble. The composite reading was 133.4 which beat the highest estimate by a lot as it was only 128. Secondly, it differed sharply from the University of Michigan August preliminary consumer confidence survey. The Michigan expectations index was flat and the current reading fell 5.8% month over month. The Conference Board index was much more optimistic as the Present index was up from 166.1 to 172.2 and the Expectations index increased from 102.4 to 107.6. Both surveys show the present index is higher than the future as the expansion is going well, but is near its end.
Another interesting divergence in the surveys was the sentiment on major purchases. The Michigan survey showed buying conditions for housing were the worst since 2008 and the buying conditions for vehicles were the worst in 4 years. However, the buying plans for major appliances, houses, and autos showed strong positive signs in the Conference Board survey. It’s fair to agree with either survey because they both have evidence to support them. The negative real wage growth and weakness in housing supports the Michigan survey and the strong retail sales growth and the recent positive earnings reports from the top retailers support the Conference Board survey.
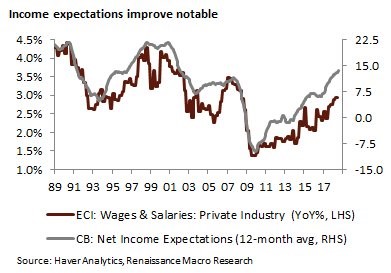
Speaking of incomes, the net percentage of consumers expecting improvement in incomes increased 7.5% in the Conference Board report. Plus, those saying that it’s difficult to find a job fell from 14.8% to 12.7%, signaling that almost anyone that wants a job can find one. The chart below compares the Conference Board’s income expectations survey with the Employment Cost Index’s measurement of year over year wages and salaries growth for private industry.

The metrics had been tracking closely to one another since 1989, but in the past few years, the Conference Board survey has accelerated higher.
We’d much rather see actual wages go up than improvement to a sentiment index. The recent negative real wage growth is ignored in this extremely positive consumer sentiment survey. One part of the report which is even further off from reality is consumers think 4.8% inflation is coming in the next year even though inflation hasn’t been that high since September 2008 according to headline year over year CPI.
Yield Curve
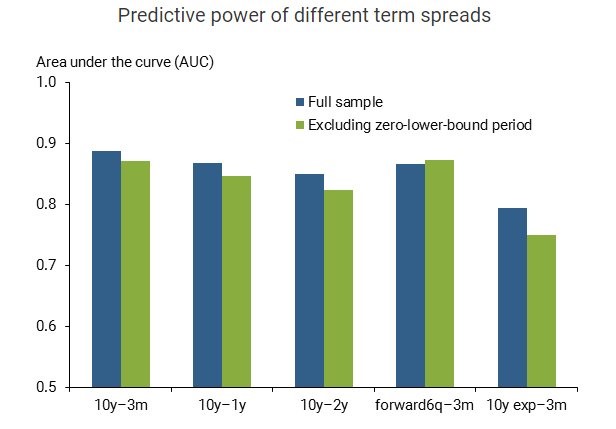
The difference between the 10 year bond yield and the 2 year yield is 21 basis points which means the curve has inched toward an inversion in the past few weeks which usually means a recession is coming (not immediately). The indicator has a better record in America than other countries such as Japan. The chart below shows the predictive power is the highest when you measure the difference between the 10 year yield and the 3 month yield. However, the other spreads are also similarly accurate at predicting recessions.

The green bar ignores the 2009 to 2015 period when short term rates were at the zero bound. Since the curve correctly predicted that a recession wouldn’t occur during that period, the green bars are lower than the blue ones. The last spread measures the expectations-only term spread. Since it is lower, it shows utilizing the term spread has historically not helped economists predict business cycles.
The chart below shows all the spreads are currently normal. The goods news is the 10 year 3 month spread is the highest and the most accurate which means there’s slightly less likelihood of a recession in the intermediate term.

Moody’s Lowers Recovery Rate Forecasts
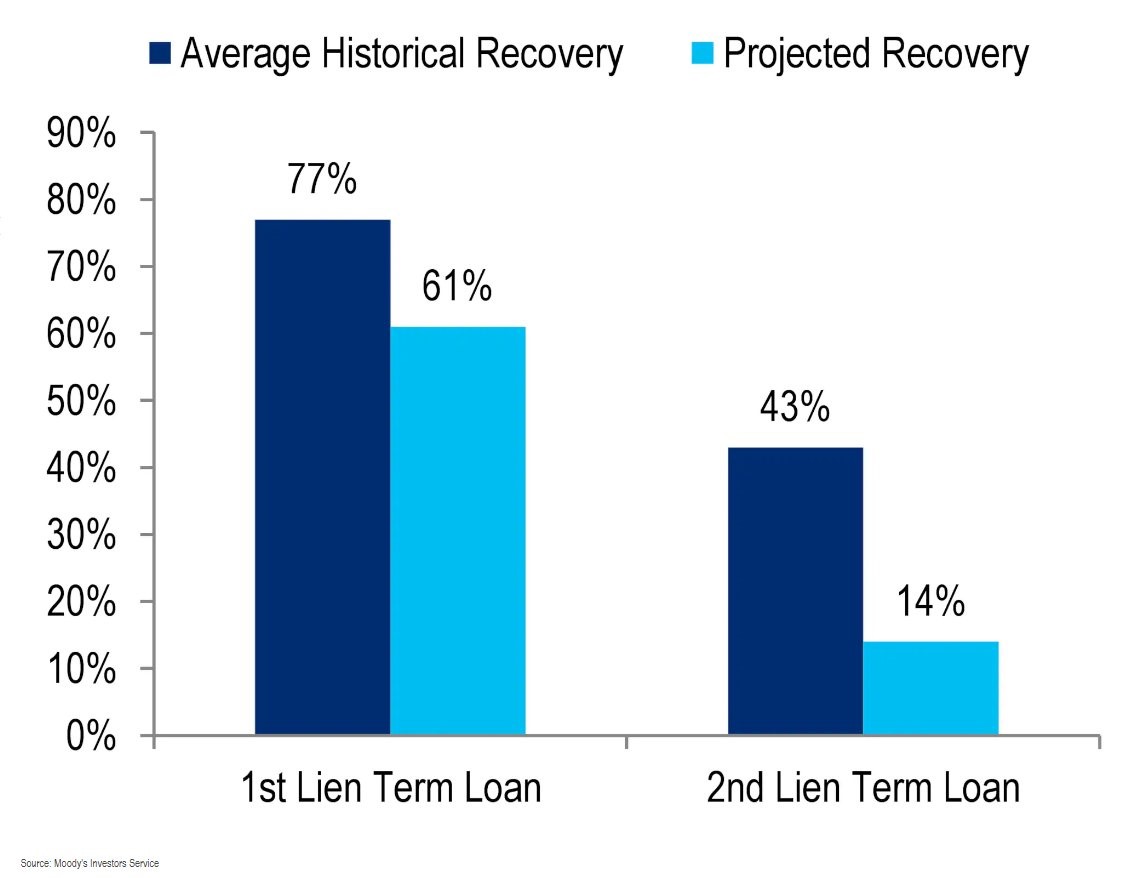
Moody’s lowered its forecast for the recovery rates for 1st lien loans and 2nd lien loans, which are much lower than the historical average.

This potentially shows us how the increase in covenant lite loans, loan only capital structures, and asset light business models will affect the bond market in the next recession. It won’t end well.
Conclusion
The U.S. economy is more durable because it is more diversified. However, the corporate debt market could be riskier because of the increased popularity of covenant lite loans. The consumer is euphoric in the Conference Board survey, yet more muted on big purchases in the Michigan survey. The yield curve isn’t signaling a recession. When an inversion gets closer, ignore the term premium and follow the difference between the 10 year yield and the 3 month yield.
Have comments? Join the conversation on Twitter.
Disclaimer: The content on this site is for general informational and entertainment purposes only and should not be construed as financial advice. You agree that any decision you make will be based upon an independent investigation by a certified professional. Please read full disclaimer and privacy policy before reading any of our content.


