UPFINA's Mission: The pursuit of truth in finance and economics to form an unbiased view of current events in order to understand human action, its causes and effects. Read about us and our mission here.
Reading Time: 5 minutes
In a previous article we showed a chart which had central bank tightening listed as a contributing factor for 29 out of the past 45 recessions in G7 nations. This article will review the latest Fed policy in a quantitative manner. First let’s review the policy prescription that has all investors and economists talking. The concept is to hike rates ‘until something breaks.’ The idea is the Fed will hike rates regardless of GDP growth trends or inflation and only stop when there’s damage to the economy.
This policy seems like an unforced error because if inflation is low, forcing us to ask the question: “Is the economy is even late cycle” in a previous article, there’s no reason to hike rates to the point where they cause the economy to slow. As investors having philosophical debates over the best policy will not help us react to it, regardless of whether we agree or disagree with it. Instead, we need to understand the reality of events and the best ways to be proactive, taking into account potential risks. The Fed is getting close to neutral policy as we discussed previously. Once it gets above the neutral rate, monetary policy slows the economy. Hawkish monetary policy could combine with the negative effects of the stimulus wearing off to bring down growth in 2019.
Fed At Neutral Rate
As we mentioned, this article measures policy quantitatively. The chart below shows the Fed funds rate along with news trends of articles about the end of rate hikes and the neutral rate.
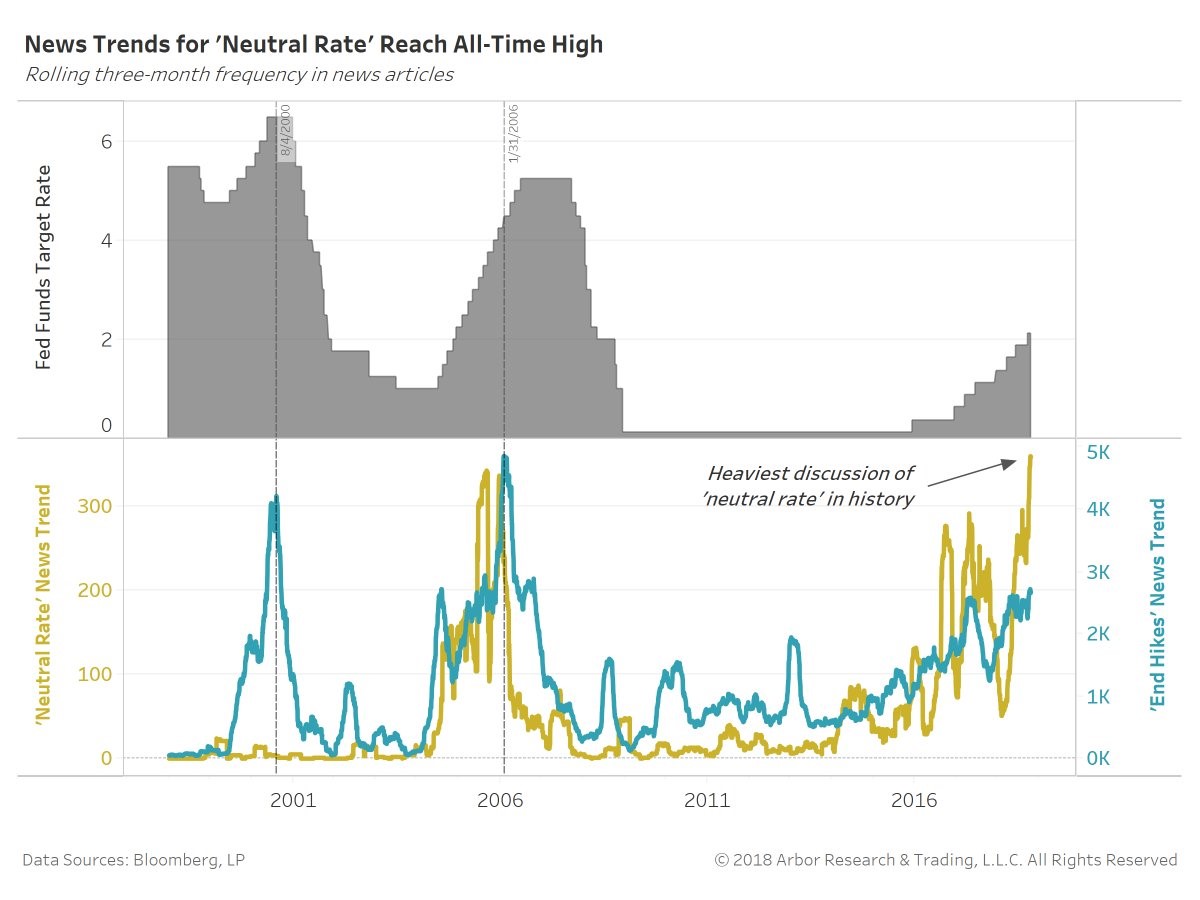
Discussion of the neutral rate is the highest ever, but keep in mind the term only became prevalent towards the end of the last cycle. The biggest signal the Fed has neutral rates is the elimination of the word ‘accommodative’ in its statement.
In the latest Minutes from the September meeting, the Fed explained why it eliminated that term. It said, the term suggests “a false sense of precision” of where the rate might be. Including “accommodative” was not “providing meaningful information in light of uncertainty surrounding the level of the neutral policy rate.” The Fed is saying the Fed funds rate is close enough to the neutral rate that it didn’t feel comfortable with keeping the term ‘accommodative.’ Policy might still be stimulative after a couple more rate hikes, but the Fed doesn’t know for sure because the neutral rate is only an estimate.
The Rate Hike Cycle Is Ending
Even though the neutral rate is an estimate, it’s not a coincidence that when this discussion occurs, the Fed is close to the end of its hike cycle (recessions follow soon afterwards). As we mentioned, the chart also shows news articles on when the Fed is done with rate hikes. This term has much more stories about it in the last two cycles, making it more relevant. When these stories peak, it means the hike cycle is almost over and a recession is closing in.
The end of the rate hike cycle occurs after neutral policy if rates rise above the long run rate because the Fed hikes ‘until something breaks.’ The stories on the end of the hike cycle will most likely increase in 2019 especially if the economy weakens. The long run rate is currently 3%. There is currently an 83.7% chance of at least one Fed funds rate hike by the end of 2018 bringing the target rate between 2.25 and 2.50. That puts the Fed 3 hikes away from hawkish policy.
Hawkometer
We don’t just have news reports to gauge Fed policy. The Wolf Street chart below shows the historical number of times the Fed Minutes have used variations of the term ‘strong’ presumably to describe the economy.
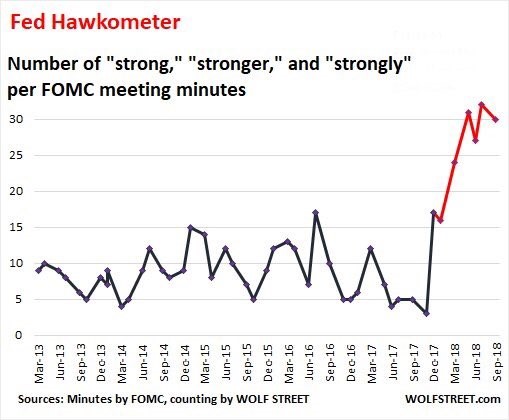
The number of mentions has increased ever since Powell has taken the helm which could mean he will support the idea of hiking ‘until something breaks.’ The other possibility is the economy simply had a growth spike in 2018 partially because of the fiscal stimulus, making the word ‘strong’ come up more often.
Inflation Is Falling
Since economic growth is strong and the expansion is about to be longer than the one in the 1990s, the obvious question to ask is what makes the rate hikes too hawkish. The chart below provides the answer.
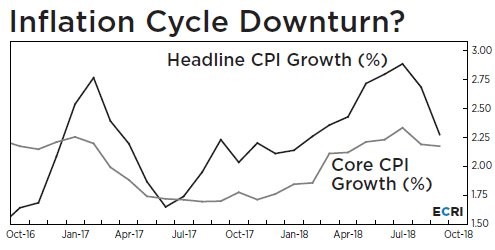
Year over year inflation growth is falling which should make further hikes unnecessary. The economy might be able to take them, but there’s no benefit if inflation is weak. This isn’t the first time the Fed has hiked rates when inflation fell. The chart shows inflation fell in 2017, but the Fed still hiked rates 3 times that year.
The Housing Market Can Break
One aspect of the economy which might be the first to falter in 2019 is the housing market. We say this because it’s already weak now. The table below shows a breakdown of existing home sales by price and region.
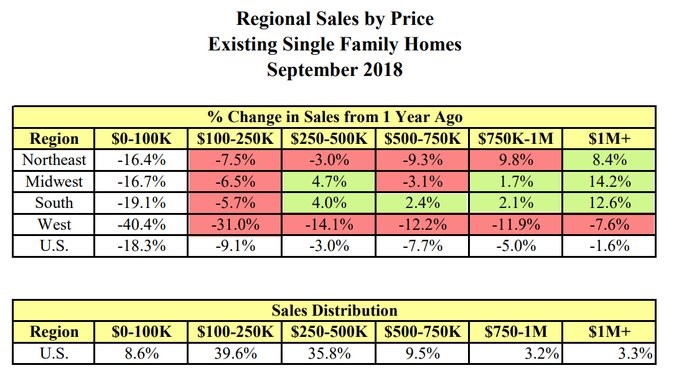
Overall, sales of existing single family homes fell 4.1% year over year to the lowest rate since November 2015. According to the chart below, the west was the worst region across multiple price ranges, down 12.2% overall. Additionally, all four census regions were down year on year.
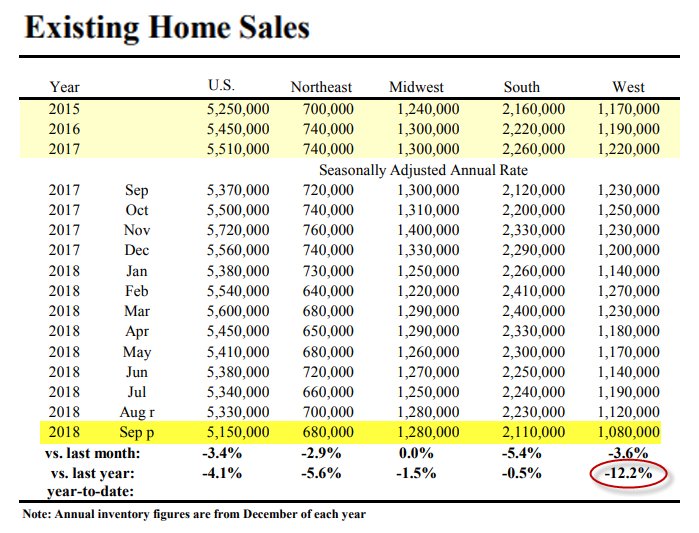
Existing home sales are down 6 straight months for the 4th time in 20 years. The other times were January 2014, October 2007, and December 1999. That’s two disconcerting periods right before recessions. The home builder ETF (XHB) is at a 21 month low, is down 21 out of the last 23 trading days, and is down 29% from its January high. All this weakness in sales implies price growth will soon weaken. Median existing home prices fell 2.8% month over month to $258,100; they were still up 4.2% year over year.
Even with limited supply, inventories are increasing because of weak sales. Unsold inventory bottomed at a 3.2 month supply in December 2017. Now the supply is up to 4.4 months. The chart below shows the historical home buying conditions.
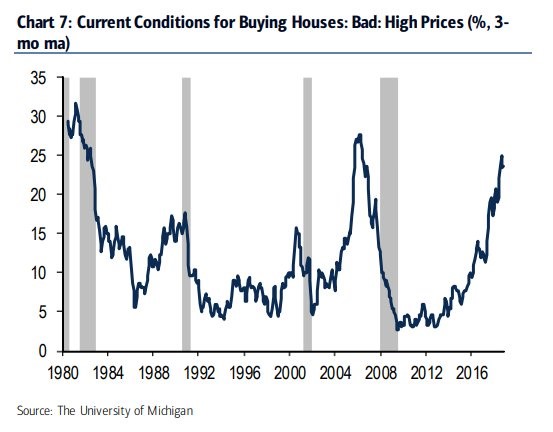
The current conditions for home buying are the worst since 2008 as affordability is tough especially with the 30 year fixed rate rising to near 5%.
Conclusion
Existing homes sales growth is weak signaling the housing market might be one of the first sectors the Fed breaks with its rate hikes. It’s amazing to see weakness in the housing market with consumer confidence near a record high and the labor market very strong. Based on weak affordability, rising rates, and weak sales, it seems like median price growth will slow in the next few months.
Have comments? Join the conversation on Twitter.
Disclaimer: The content on this site is for general informational and entertainment purposes only and should not be construed as financial advice. You agree that any decision you make will be based upon an independent investigation by a certified professional. Please read full disclaimer and privacy policy before reading any of our content.


