UPFINA's Mission: The pursuit of truth in finance and economics to form an unbiased view of current events in order to understand human action, its causes and effects. Read about us and our mission here.
Reading Time: 5 minutes
As we previously discussed, real wage growth is becoming a reality, having appeared in August. Average hourly earnings were up 2.9% and weekly earnings growth was 3.2%. Inflation stats have come in below expectations as we will discuss in this article. Before we get to that, it’s worth noting that the Fed will continue along with rate hikes even though inflation is moderating. The current chance of at least 2 more rate hikes in 2018 is 79.3% as the Fed will hike rates if growth is strong.
There’s fear of wage inflation driving up overall prices, but even with cycle high wage growth, inflation is still modest. If rates increase and inflation falls, real rates will quickly become positive. That’s one sign of more constrictive monetary policy. It will be interesting to see if the Fed stops saying policy is accommodative after its rate hike in September. There’s still a significant difference between neutral policy and constrictive policy, but we are inching closer with each rate hike. If you’re wondering when the cycle will end, we might not need a big burst of inflation to cause a recession if the Fed is going to steadily raise rates while inflation falls.
Negative PPI-FD
The main theory on Wall Street is the economy has about 2 years left in the business cycle. With solid growth in the first half of the year, strong wage growth, and the economy supposedly edging close to the end of the cycle, you’d expect inflation to be increasing significantly, but it isn’t. As you can see from the chart below, the producer price index declined 0.1% on a month over month basis in August.
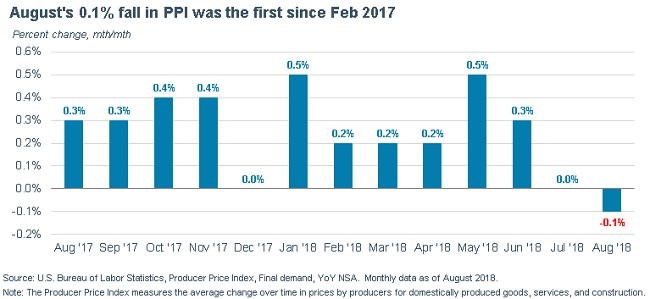
That was the first decline since February 2017. This report missed estimates across the board. Month over month headline inflation was expected to be 0.2%. Year over year inflation fell from 3.3% to 2.8%. Keep in mind the producer price index measures prices at the base of the supply chain. Price changes are passed on to the consumer in various degrees.
Without food and energy, PPI was down 0.1% month over month. On a year over year basis, growth fell from 2.7% to 2.3%. Food prices were down 0.6% month over month and energy was up 0.4%. Trade services inflation was a big reason results fell. PPI without energy, trade and food was up 0.1% month over month and increased from 2.8% to 2.9% year over year. Trade service prices fell 0.9% in August and 0.8% in July. They were up only 0.8% year over year. Personal consumption measures were flat with and without food and energy which implies weak PCE and core PCE numbers are coming. It’s interesting to see how tariffs have affected metals prices. Steel mill prices were up 18.6% year over year; aluminum prices were up 14% and fabricated metals prices were up 15.7%.
CPI Also Misses Estimates
Both PPI and CPI show inflation moderated in August. Month over month headline CPI was up 0.2% which missed estimates for 0.3%. Year over year headline inflation was up 2.7% which fell from 2.9% and missed estimates for 2.8%. Core CPI was up 0.1% month over month which missed estimates for 0.2%. Year over year core CPI was up 2.2% which missed estimates for 2.3% and fell from 2.4% in July.
The chart below shows the net number of subcomponents with accelerating year over year changes.
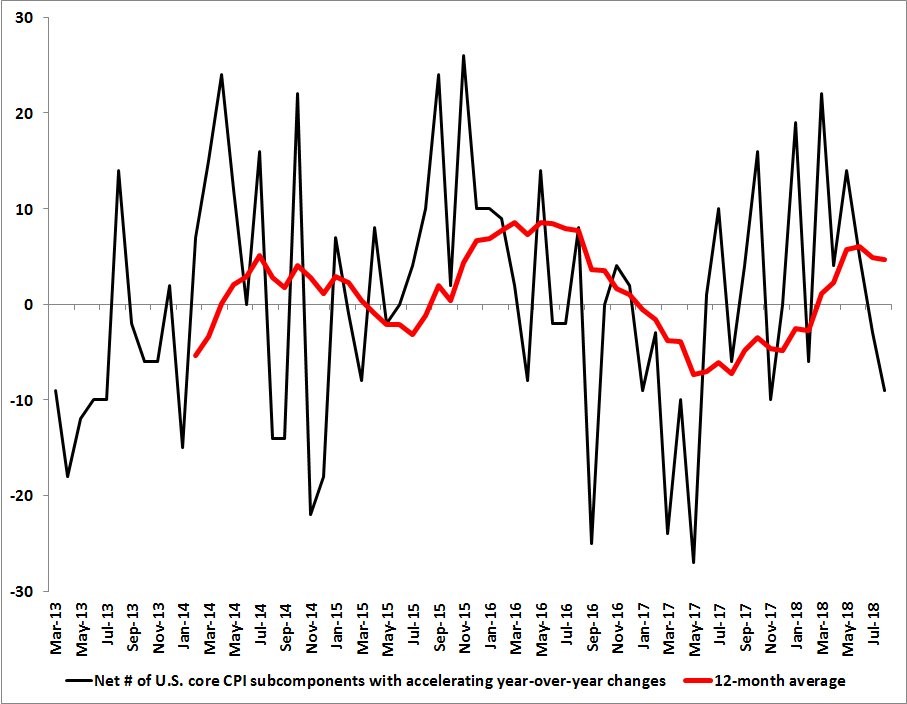
The latest result is more subcomponents decelerating than accelerating. The Fed hiked rates 3 times in 2017 even as CPI decelerated. The 12 month moving average looks to be peaking near where it did in 2016 and 2014, just how headline inflation is near its peak.
Medical costs and apparel prices fell and food prices were only up moderately month over month. Medical care is down 2 months in a row. As you can see from the chart below, it is almost 10% of the index.
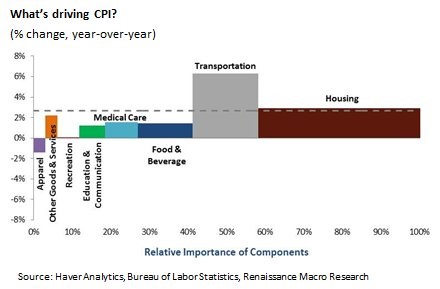
The width of the bars tells you the percentage and the height tells you the level of price appreciation. Year over year medical costs were up 1.5% which means it was a significant drag on CPI. Food and beverages are even more important to CPI. They were up 0.1% month over month and 1.4% year over year. Housing prices are over 40% of CPI. Even though they increased 0.3% month over month and 2.9% year over year, which is only slightly above the overall rate, they are a big driver of inflation because housing is a huge component.
Rent Is Affordable?
Real estate is local. Just because there has been massive appreciation in areas such as Seattle, San Francisco, and Denver, doesn’t mean all areas aren’t affordable. If you’re moving, you must weigh the costs and benefits. On the one hand, cities with housing appreciation have a good job market, but on the other hand, housing and rent aren’t affordable. Some people have long commutes to have the best of both worlds. The Redfin chart below shows the top 20 metro areas with falling rent as a percentage of income.
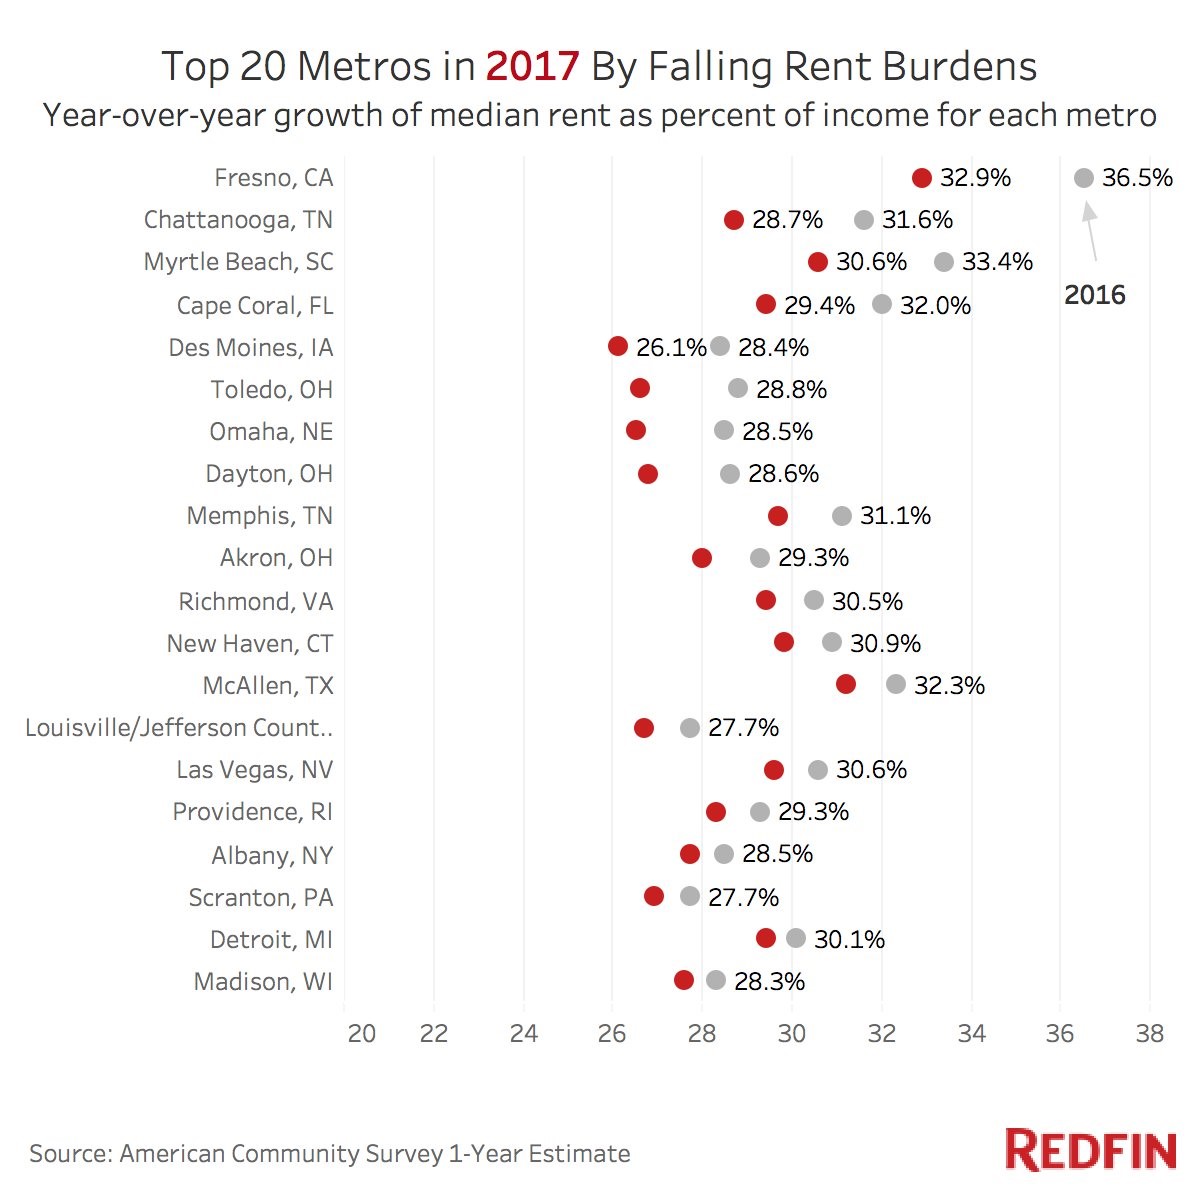
Fresno’s median rent as a percent of income fell from 36.5% to 32.9%, making it more affordable. The most affordable city on this list is Des Moines, Iowa which has a median rent to income ratio of 26.1%.
The EyeOnHousing chart below explains one reason why overall housing has become more expensive in 2018.
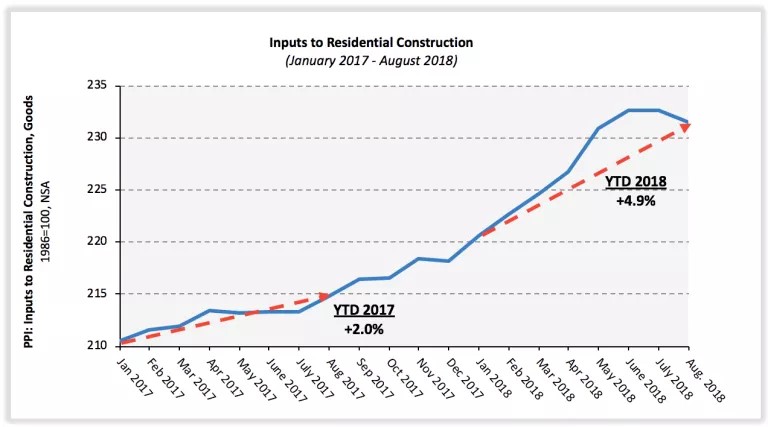
Year to date inputs to residential construction are up 4.9% in 2018 which is over double the 2% increase in the same period in 2017. Gypsum prices are up 6.1% in the past two months.
Conclusion
Nominal wage growth is accelerating, but inflation is decelerating. This means real wage growth accelerated in August. As inflation comparisons get tougher, real wage growth should increase. Eventually wage growth will catalyze inflation. That will spell the end of the cycle, but until then the economy should avoid a recession. The Fed is about to get more aggressive with rate hikes, expected to hike rates 2 more times by the end of the year even as inflation moderates.
Have comments? Join the conversation on Twitter.
Disclaimer: The content on this site is for general informational and entertainment purposes only and should not be construed as financial advice. You agree that any decision you make will be based upon an independent investigation by a certified professional. Please read full disclaimer and privacy policy before reading any of our content.


