UPFINA's Mission: The pursuit of truth in finance and economics to form an unbiased view of current events in order to understand human action, its causes and effects. Read about us and our mission here.
Reading Time: 5 minutes
Some readers may question why we discuss inflation so much since it hasn’t catalyzed a change in the economic cycle in years. We contend the lack of inflation has been a major reason why this has the potential to be the longest expansion in over 100 years. With that in mind, we’ll look at the September PPI and CPI inflation readings which were released this week. Both readings showed weak inflation, with PPI sending more of a mixed signal and CPI showing deceleration in price growth.
The producer price index is early in the supply chain, meaning it shows where inflation could be headed if producers directly pass down changes in costs to the consumer. Sometimes cost increases aren’t passed down right away because producers worry about losing sales and market share. This was a mostly dull PPI reading that was helped by transport services and brought down by trade services. Specifically, month over month headline PPI was up 0.2% which met estimates. It was up 2.6% year over year which was a 0.2% deceleration from August. Transport prices drove inflation as the shipping sector had capacity constraints. Transport prices were up 1.8% month over month and 5.9% year over year. There is a lack of trucks and drivers.
Headline inflation was almost the same as it was without food and energy. Core inflation was 0.2% month over month and 2.5% year over year. The difference here is year over year inflation accelerated 0.2%. Even though food and energy are volatile with spikes occurring often, energy prices were down 0.8% and food prices were down 0.6%. Goods prices overall were down 0.1%. Construction prices were only up 0.1%, but they did increase 3.4% year over year. This industry has capacity constraints.
Tariffs aren’t increasing metals prices any further as steel mill prices were flat month over month and aluminum prices fell 0.3%. The year over year growth of 18.1% and 10.7% reflects the spike after the tariffs. The one reading which showed heightened inflation was core inflation which also excludes trade services. That was up 0.4% month over month and 2.9% year over year. It was high because trade services inflation was weak again.
CPI Decelerates: Perfect For Real Wage Growth
Once again, the CPI reading followed closely with the PPI reading. CPI was even weaker as monthly headline prices were up 0.1% which missed estimates for 0.2%. Year over year prices were up 2.3% which was down from 2.7% growth in August. The chart below shows the major categories on a seasonally adjusted basis.
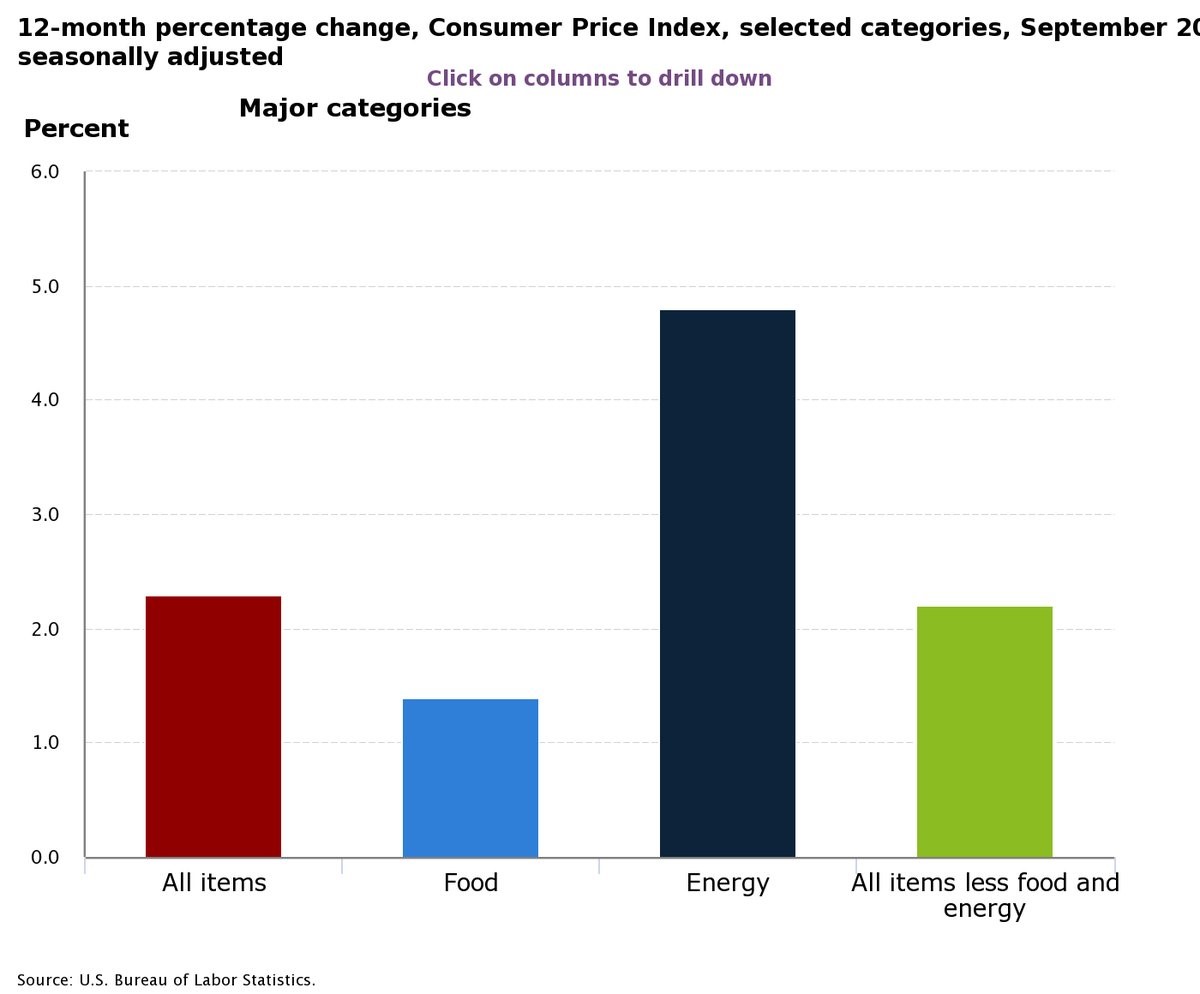
Even with spiking energy prices, headline inflation declined. Energy was weak on a month over month basis as it fell 0.5%. Food prices were flat monthly and only up 1.4% on a year over year basis.
Core CPI was 0.1% month over month and 2.2% year over year. Core inflation is barely above the Fed’s 2% target. Since PCE is usually below CPI, core PCE will probably be at or below target for the most followed metric. The two most interesting parts of this report are transportation fell 0.3% because used vehicle prices fell 3% and housing CPI was only up 0.1%, with owner’s equivalent rent increasing 0.2%. The table below spells out the details on a year over year non-seasonally adjusted basis.
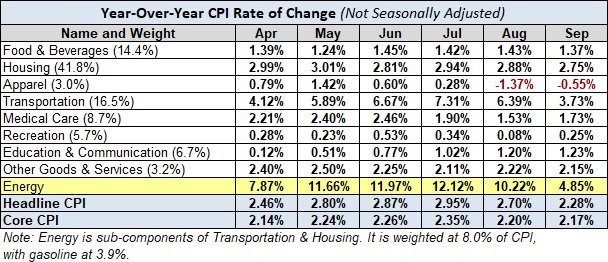
Housing inflation has dragged CPI up this expansion which has led to housing prices being unaffordable. Price growth has decelerated in the past 2 reports.
Positive Real Rates & Real Wage Growth
We have been discussing in articles over the past few weeks how real wage growth could look good soon because inflation will decelerate and nominal wage growth will be strong. Average hourly earnings growth fell 0.1% to 2.8% and headline CPI growth fell 0.4% to 2.3%. That’s an amazing trade off for those looking for real wage growth.
The real Fed funds rate is also positive because of this decline in inflation. The chart below shows the Fed funds rate is higher than core CPI.
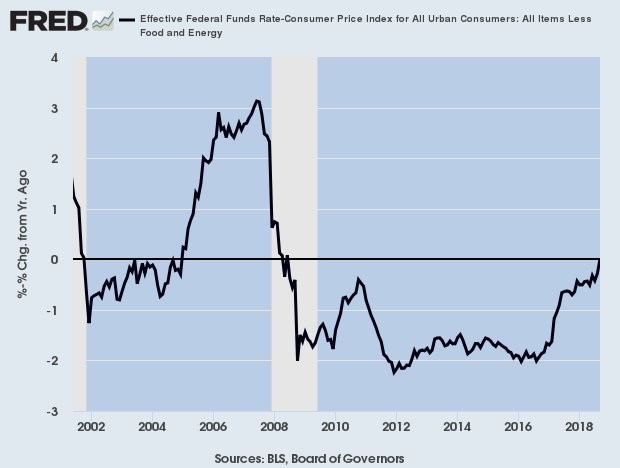
In theory, this means the Fed now has near neutral policy. The only way to tell for sure is to look at the effect monetary policy is having on the economy. That’s always difficult because there is noise in the data. In 2018, the noise is the fiscal stimulus. Rate hikes might be hurting growth, but the stimulus is probably helping it more.
Fed’s Response To Inflation
It’s interesting that the Fed raised rates 3 times in 2017 even though inflation fell. Now we see CPI decelerating, but the Fed is still expected to raise rates for the 4th time in 2018 in December. The Fed could be worried that wage inflation will drive the overall index higher. It could have also decided to raise rates as much as the economy and the stock market let it. It’s not your imagination that the Fed has been more respondent to the stock market recently. As you can see from the chart below, since the crisis the Fed has turned dovish when stocks have fallen 12.5%.
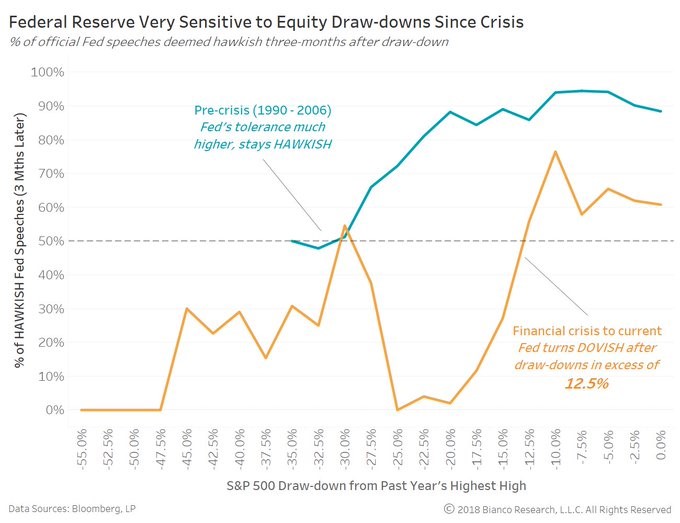
From 1990 to 2006, it didn’t react as much to corrections. The stock market had a great year in 2018 up until the October correction. Therefore, you have 4 rate hikes.
Stocks Trouncing Commodities
Even though inflation has increased modestly in 2018, the CRB commodities ETF is only up 1.99% year to date. That’s with rising oil prices and tariffs. This has been a terrible run for commodities versus stocks as you can see from the chart below.
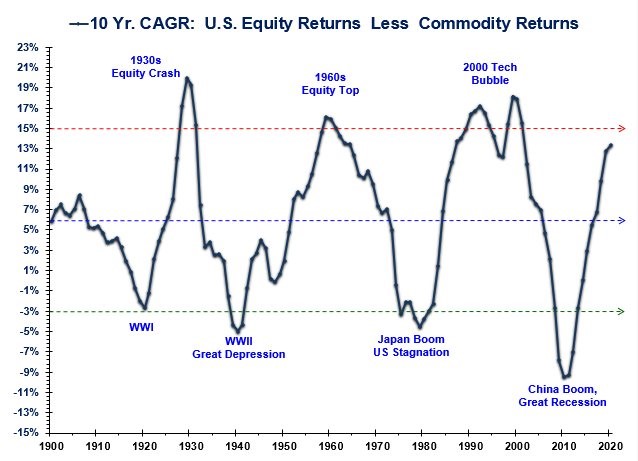
The market is nearing the point where equities’ 10 year compound annual growth rate outperformance over commodities has peaked previous cycles. That’s something to look out for in the next few years. It has been a low inflation boom time for tech stocks. That could change in the upcoming decade.
Conclusion
Inflation is falling. Usually inflation catalyzes the end of business cycles. If inflation stays on this path, the expansion should continue in 2019. The Fed’s rate hikes could slow the economy. The Fed can easily stop its rate hikes if that happens because inflation is so low. The anecdotal guess that the Fed is focused on stock returns instead of inflation is supported by quantitative analysis. Wait for stocks to fall 12.5% and then look for dovish statements from FOMC members.
Have comments? Join the conversation on Twitter.
Disclaimer: The content on this site is for general informational and entertainment purposes only and should not be construed as financial advice. You agree that any decision you make will be based upon an independent investigation by a certified professional. Please read full disclaimer and privacy policy before reading any of our content.


