UPFINA's Mission: The pursuit of truth in finance and economics to form an unbiased view of current events in order to understand human action, its causes and effects. Read about us and our mission here.
Reading Time: 5 minutes
We’ve discussed the price to income ratio of housing in a previous article. This gave us an idea of how expensive housing has become. We’ll discuss some of best points why real estate is too expensive and then provide the counterpoint explaining why housing isn’t in a bubble.
Housing Isn’t Affordable
In a May survey of those living in the top 25 metropolitan statistical areas, 52% of respondents said the lack of available housing that is affordable is a big problem and 24% said it isn’t a problem. In 2005, which was near the peak of the housing bubble, 51% said this was a big problem and 28% said it wasn’t a problem. As you can see, this poll shows more people thought housing was unaffordable in 2017 than during the 2008 housing bubble.
The problem is so bad, there was a recent survey in Palo Alto which asked if residents considered themselves middle class. Some respondents making as much as $400,000 per year stated that they were in the middle class. This isn’t an example of rich people who are out of touch with reality; housing is so expensive, it cripples people. The median household income in Palo Alto is $137,000 and the income per capita is $79,000. This is a problem because the median sale price of homes is $3 million. Homes sell at 110% of the list price. This is consistent with the previous polling we mentioned because when you break down that poll by geography, the pacific coast has the highest percentage who said housing affordability is a big problem (69%). Price inflation has also been significant on the West coast. The situation isn’t as bad outside of metro areas as only 36% said affordability was a big problem.
The chart below is the John Burns affordability index.

Housing About to Become Unaffordable
The John Burns Affordability Index calculates the relationship between median incomes and housing costs such as the mortgage, taxes, insurance, and mortgage insurance equivalent to 80% of the home. The current situation is near the cusp between the median and least affordable markers. It is expected to be in the least affordable category in the next year. Keep in mind, if interest rates rise, the affordability index will quickly spike.
People Are Buying Houses They Can’t Afford
Unsurprisingly, disappointing wage growth and expensive housing means people are once again buying houses they can’t afford. The chart below shows the percentage of respondents who think people buying homes they can’t afford is a big problem.
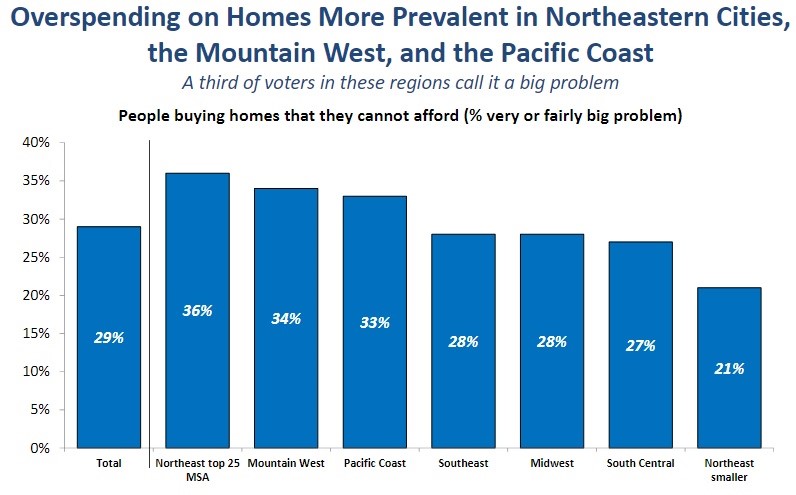
Overspending On Homes Becoming A Big Problem
The top northeast metro areas like New York City have the largest issue as 36% say that buying homes they can’t afford is a big problem. Those who are wealthier are more likely to buy a home which strains their budget. 62% of people with an income over $100,000 would buy a home that strains their budget compared to 47% of those with an income under $60,000. Those with low incomes are also less likely to buy a home.
Down Payment History
One way to determine if people are buying houses they can’t afford is to look at the historical down payment percentage. The higher the percentage, the more affordable housing is and the less chance the housing market is in a bubble. In 1989, the average down payment was 10% for new buyers and 23% for repeat buyers. At the peak of the housing bubble in 2005-2006, the new home buyers put only 2% down payment. That’s why borrowers were able to walk away from their house easily. If the price of the house is down 40% and you only paid 2%, it’s logical to step away. The trough for repeat buyers was 13% in 2012 and 2014. It has been 13-14% for repeat buyers in the past 4 years. Currently, the median down payment for first time home buyers is 6%.
Making a down payment below 20% means you are required to get home owner’s insurance to protect the bank. This costs about 1% of the purchase price every year until you get the loan to value ratio down to 80%. It’s a bad sign that there are now articles promoting the concept of putting less than 20% down because they say you can invest the money in stocks or use it to make renovations. Firstly, putting that money in stocks is far from a guarantee, as we discussed previously. Secondly, a bigger down payment lowers your monthly mortgage payment. We can’t give personalized advice in a general article, but it’s certainly a better idea to put 20% down than 6%. The crude reality is you probably can’t afford the house if you can only save 6% for the down payment. This situation has exceptions obviously.
Young People Value Homeownership Less
The table below shows a few questions about housing.
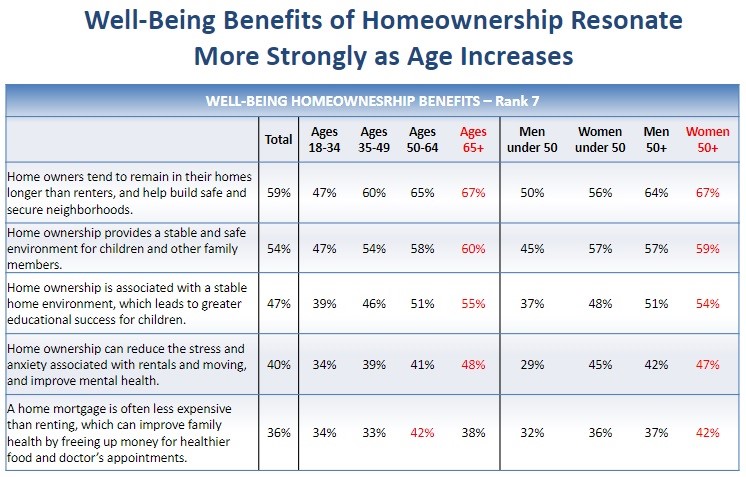
Older People Appreciate Housing More Than Young People
The trend is that older people have a more favorable opinion on home ownership. One example is that 20% more people who are 65+ think home owners stay in their house longer than renters and build safe neighborhoods than those who are age 18-34. Millennials tend to value experiences more than buying a house. Renting allows for a greater disposable income and makes it easier to move.
Wage Growth Is Part Of The Problem
The chart below compares real disposable income (DPI) growth with home price appreciation.
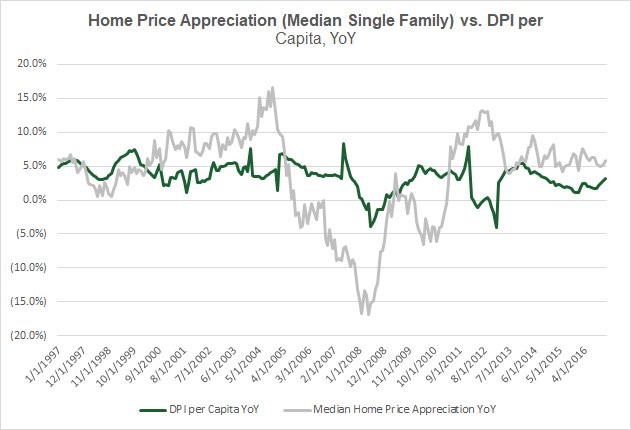
Home Prices Growing Faster Than Wages
The home price appreciation has almost exclusively been higher than real DPI growth in this business cycle. There will probably be a point in the next recession where housing price changes fall below changes in real DPI.
Counterpoint To The Bubble Talk
The counterpoint to the thesis that home prices are in a bubble is that the price to income ratio doesn’t look at actual mortgage payments. Borrowers have locked in low rates with reasonable payments. The problem is with prospective buyers, not owners. The borrowers with mortgages also have high credit scores, unlike what was the case that lead to the 2008 housing crisis. These two factors mean rampant defaults are unlikely, so a crash like 2008 is out of the question. The chart below calculates the risk in the housing credit market.
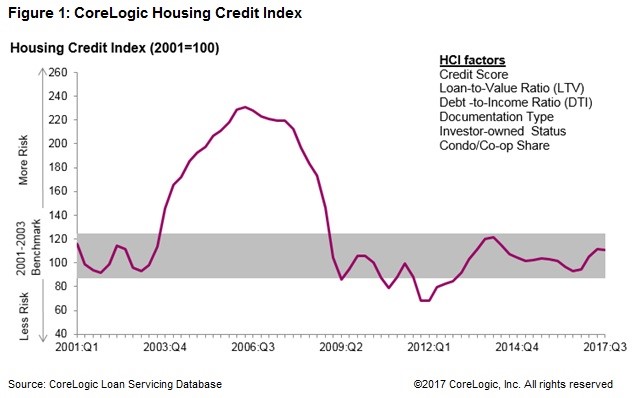
Housing Credit Is Normal
It is in the normal range as the average credit score is 742, the average debt to income ratio is 36%, and the average loan to value is 78%.
Conclusion
Housing isn’t affordable for new buyers in the top 25 metro areas, but the housing market isn’t in a bubble, aside from certain areas, because home owners were properly vetted before they took out mortgages. The biggest risk to the housing market is rising interest rates. That could force home values to decline, but there won’t be a crash because there won’t be a spike in defaults like in 2008. The second biggest risk is the labor market weakening. While this will cause a problem in the next recession, the issue won’t be systemic.
Have comments? Join the conversation on Twitter.
Disclaimer: The content on this site is for general informational and entertainment purposes only and should not be construed as financial advice. You agree that any decision you make will be based upon an independent investigation by a certified professional. Please read full disclaimer and privacy policy before reading any of our content.


