UPFINA's Mission: The pursuit of truth in finance and economics to form an unbiased view of current events in order to understand human action, its causes and effects. Read about us and our mission here.
Reading Time: 5 minutes
The June BLS employment report showed a lot of the same trends we’ve been seeing for the past couple years, with one outlier stat we will review later in the article. The total job growth was 213,000 which beat estimates for 190,000 jobs created. The slight weakness seen in the ADP report which showed 177,000 private sector jobs created instead of 190,000 jobs created was avoided. The beat was largely because of the manufacturing jobs created as the sector added 36,000 jobs instead of 15,000 jobs. That represents 21,000 of the 23,000 beat in the headline number.
Is Wage Growth Strong?
The steady trends were the headline jobs growth, the strong manufacturing growth, and the increasing wage growth. Wage growth depends on how you calculate it. The media harped on the disappointing hourly earnings growth as the year over year growth of 2.7% and the month over month growth of 0.2% both missed estimates by 0.1%. The big story was how wage growth could possibly be missing estimates with such strong job growth.
The reality is nominal weekly wage growth is still very strong and real wage growth is still problematic. The average work week was flat at 34.5 hours. This led the average weekly earnings growth to be 3%. It was about the same as last month’s growth rate as you can see in the FRED chart below.

Source: FRED
3% growth is one of the quickest growth rates of this expansion. The peak was 3.4% in October 2010. Weekly earnings growth accounts for changes in the length of the work week, showing you take home pay growth. This is why it is a better stat than hourly wage growth.
That’s not to say wage growth is spectacular because the only thing that matters for workers is if pay growth is higher than inflation. Recently it hasn’t been higher as real wage growth was negative 28 basis points in Q1 due to rising inflation. The headline CPI was up 2.8% in May and is expected to be up 2.9% in June because of rising energy costs. Energy inflation boosts the headline number and shelter inflation boosts core inflation. Consumers don’t get to take out costs which have big increases to smooth the data; they need to pay for shelter and energy, which means they are in a stagnant situation rather than an improving one like you might expect when the labor market is tightening. The FRED chart below shows real wage growth has been tough to achieve consistently since 1980.
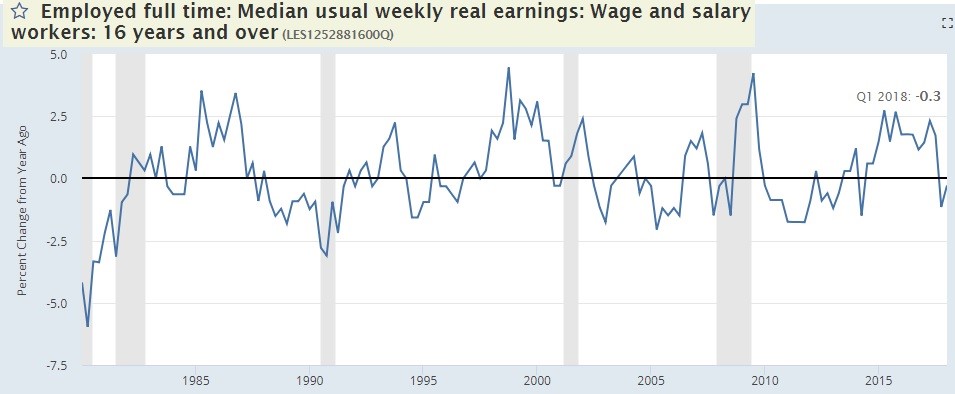
Source: FRED
Labor Market Not Full
The biggest story from this report is that the labor market isn’t full. You can’t have job growth of 213,000 in a full labor market. There are some industries which have labor shortages such as trucking, but the overall labor market still has slack to give. The chart below, which uses Haver Analytics data, shows the 12 month average payroll growth and the 12 month average growth needed to keep pace with population growth.

Source: Haver Analytics
The 12 month average is 198,000 and the level needed to keep pace with population growth is only 93,000 jobs. This means the economy is producing more than double the jobs necessary because there is slack in the labor market. The job growth will be in line with the labor force growth when the labor market is at full employment.
Massive Influx Of New Workers Coming Off The Sidelines
There was a huge increase in workers coming off the sidelines in June. People who economists thought were detached from the labor market have started looking for jobs. These workers count as long term unemployed because the calculation bases their status on the last time they had a job. The number of unemployed people actively looking for work increased from 6.065 million in May to 6.564 million in June. This pushed up the unemployment rate 0.2% to 4%.
Even though this stat is normally associated with huge job losses, it’s now a positive because it means the long term unemployed are so confident in the job market, that they are looking for work again. Many of the people who gave up looking for work after the financial crisis have re-entered the labor market. Therefore, the labor force participation rate increased from 62.7% to 62.9%. The chart below shows the month over month percent change in the number of people who have been unemployed for 27 weeks or more.
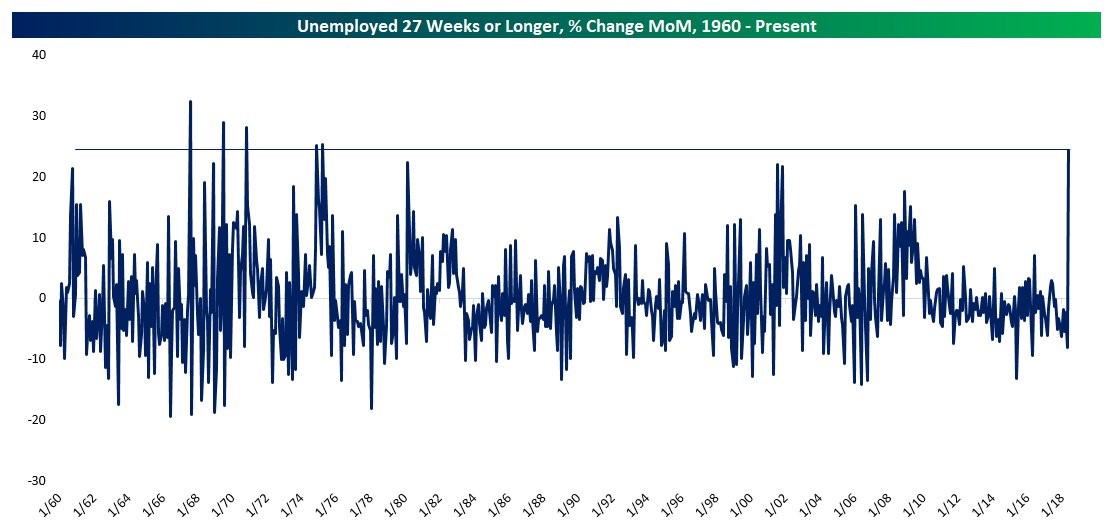
Source: Twitter @pearkes
There was a 24.3% increase in June which equated to 289,000 new people. This is the biggest percentage increase since the 1970s.
The chart below shows the change in the long term unemployed workers and the change in number of people going from “not in the labor force” to “employed.”
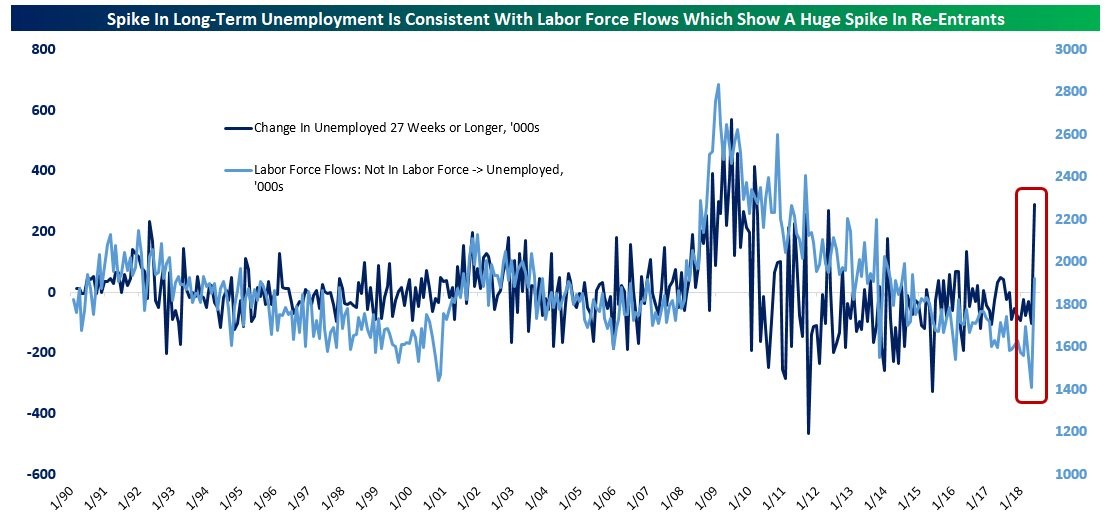
Source: Twitter @pearkes
Like we said, this is good news. However, if it isn’t backed up by a few more months of data, it will be a one off event. If these people keep coming back into the labor market, the labor force will continue to have excess slack, extending the expansion.
Prime Age Workers Show Labor Force Still Not Full
The overall labor force participation rate is declining because of an aging population and because young people work less than in the past as they are spending more time getting educated even in the summer. That’s why we look at the prime age labor participation rate.
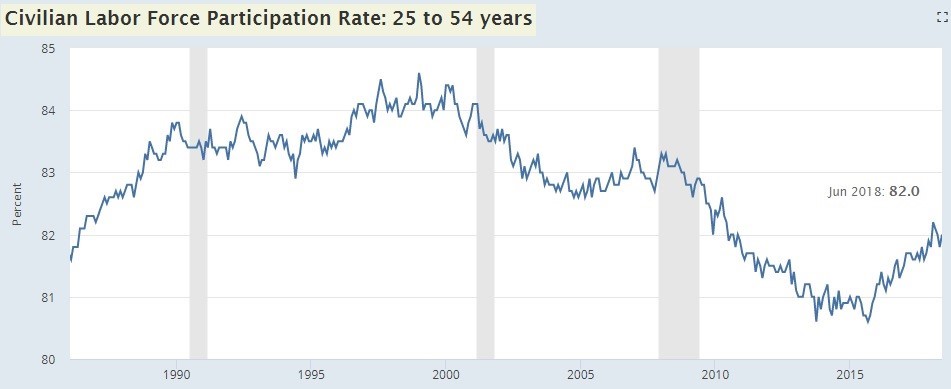
Source: FRED
The reading increased to 82% in June from 81.8% in May. The rate started to increase in Q4 2015 which signaled the labor market was finally starting to tighten. Looking at the last two cycles, it seems like 83% would be the low end of the range where the labor market is full. The rate increased from 81.2% in January 2016 to 81.8% in January 2018. At that pace, the labor market won’t be tight until mid-2021.
Conclusion
The labor market is creating a lot of new jobs and the prime age participation rate signals there’s still room for more job creation for the next 3 years. However, the current wage growth is close to the inflation rate, which means real wage growth is either low or negative. Average hourly earnings were up 2.7% and weekly earnings growth was 3%. The CPI is expected to be up 2.9% in June.
Have comments? Join the conversation on Twitter.
Disclaimer: The content on this site is for general informational and entertainment purposes only and should not be construed as financial advice. You agree that any decision you make will be based upon an independent investigation by a certified professional. Please read full disclaimer and privacy policy before reading any of our content.


