UPFINA's Mission: The pursuit of truth in finance and economics to form an unbiased view of current events in order to understand human action, its causes and effects. Read about us and our mission here.
Reading Time: 5 minutes
In this article we will look at what drives stock prices: valuations and earnings. Anytime we discuss monetary policy or the economy, we are doing so with the intention of figuring out how valuations and earnings will be affected. As you probably are aware of from our articles, the US stock market is doing well compared to the rest of the world. China is leading emerging markets lower. This has led to an extraordinary divergence between American valuations and the valuations of international equities.
As you can see from the chart below, the price to book value of US stocks versus the price to book value of the MSCI all country world index excluding America is at a record high.
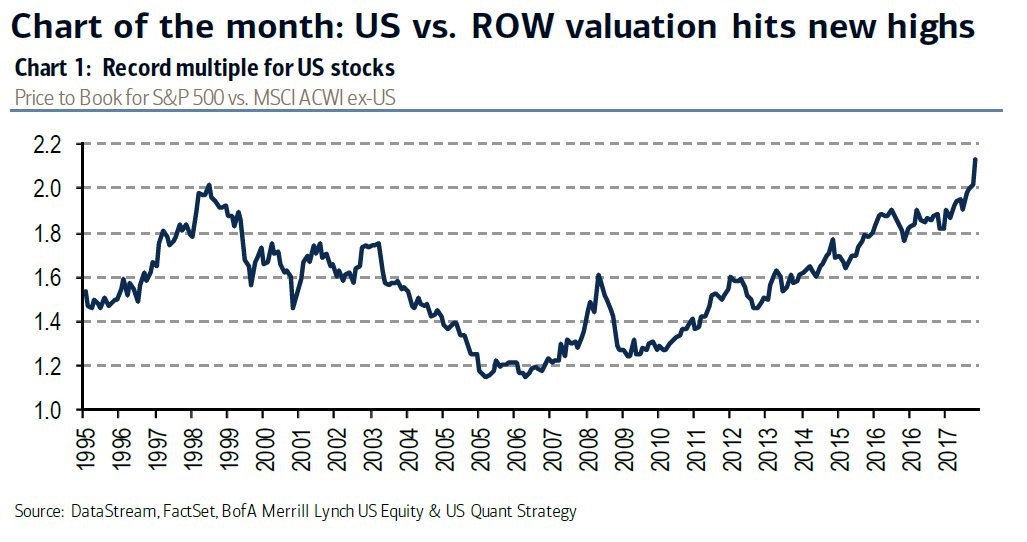
American stocks always have higher valuations because of the country’s strong economic fundamentals such as free markets, a stable political system, and decent demographics compared to other developed markets such as Europe and Japan. America is home to the world’s largest tech firms which have high multiples, but also high growth.
14 Out Of 20 Metrics Say U.S. Stocks Are Expensive
There’s strong justification for America to have above average valuations, but it’s more difficult to defend record valuations in relation to the rest of the world. The best defense of U.S. stocks might be that the price to book value is a flawed valuation tool. If you believe that and don’t like comparing America to the rest of the world, you can review the table below.
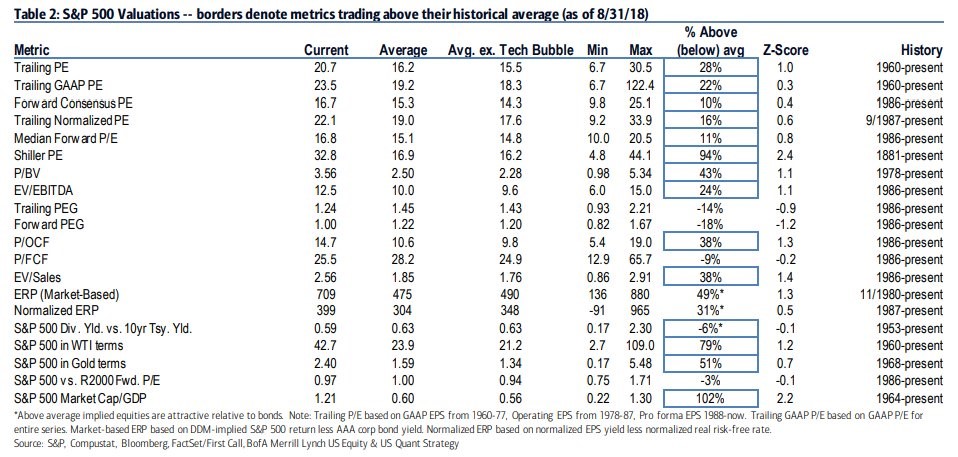
14 of the 20 valuation metrics above state the S&P 500 is expensive. There have been similar results for a while, but stocks keep moving higher. That’s because the economy and earnings are growing. We need to see earnings growth disappointments and eventually a decline in earnings to see stocks fall.
Weak Earnings Preannouncements
If you are trying to determine where earnings are headed, it’s important to review earnings pre-announcements. The pre-announcements for Q3 2018 earnings haven’t been great. The best way to describe them is tepid because there haven’t been many so far. As you can see from the FactSet chart below, 76% of firms have issued negative guidance.
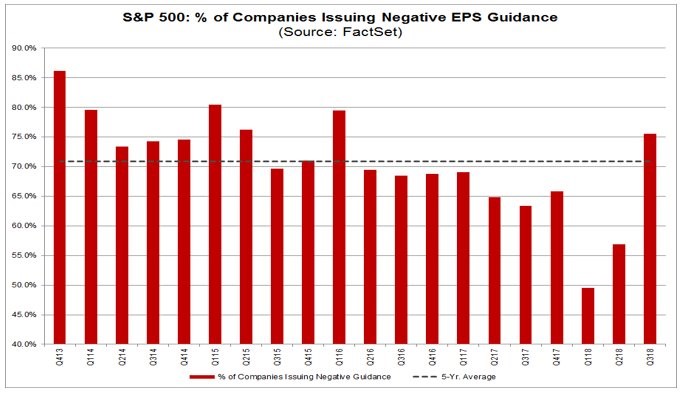
To be clear, there are almost always more firms issuing negative guidance than positive guidance. However, Q3 has been much worse than Q2 and it’s above the 5 year average of 71%.
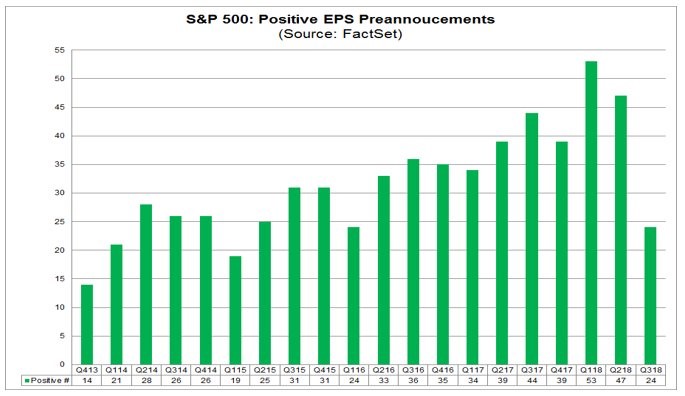
We can’t just stop our analysis at that metric because there is more to the story. Even though negative guidance is above the 5 year average, the number of companies issuing negative guidance (74) is 3% below the 5 year average. The overall guidance percentage is weak because, as you can see from the FactSet chart above, only 24 firms have issued positive guidance which is 23% below the 5 year average of 31. If it stays at 24, this is the lowest number of positive pre-announcements since Q1 2016.
Since both are below average, it’s not surprising that the overall number of pre-announcements (98) is below the 5 year average of 107 and the lowest since Q1 2015. The sector with the biggest divergence from its 5 year average of firms with positive guidance is consumer discretionary which has 2 so far. This is below the 5 year average of 5.6. There could be a decline in positive guidance because of the uncertainty surrounding tariffs.
Q3 Reports So Far
8 S&P 500 firms have reported their Q3 earnings so far. The results are pretty good as 7 of 8 firms beat their EPS estimates. The surprise rate was 3.03%. As you can see from the top Earnings Scout chart below, the average earnings growth is 25.9%. This is below the last 2 quarters. However, keep in mind that Q2 had higher growth than Q1; it caught up after the rest of the firms reported.
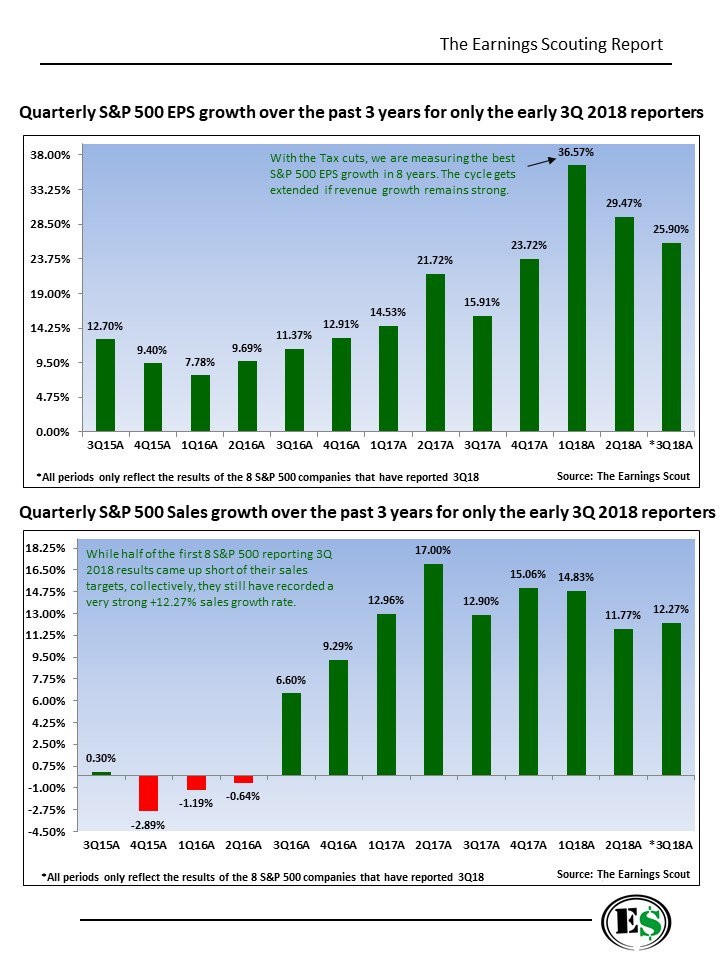
The bottom Earnings Scout chart from above depicts sales results. Even though the sales beat rate was only 50% with an average surprise of 0.55%, sales growth was higher than Q2 which had an 88% beat rate. Along with this fantastic 12.27% sales growth the average tax rate for these 8 firms was 8.98% which is significantly below the corporate tax rate of 21%.
Different Perspectives
Whether you think future earnings estimates are bullish or bearish for stocks today depends on how you look at the data. The chart below makes earnings estimates and stocks look they have for most of this expansion.
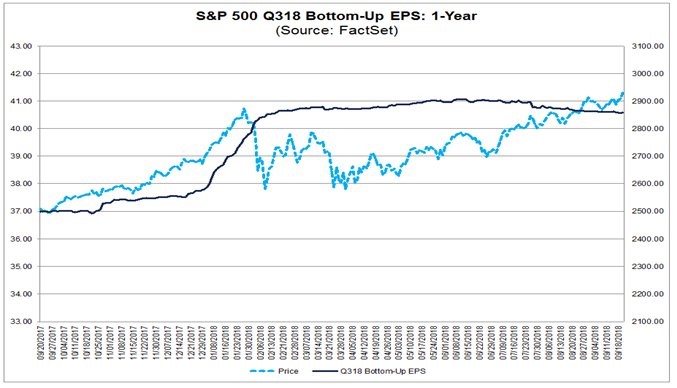
Q3 earnings estimates are up 9.7% in the past year, but are down 1% since June 30th. This is while the S&P 500 is up 7.81% since the end of June. Increasing stocks and decreasing earnings estimates has been a theme this expansion as estimates are lowered so firms can beat them. This trend is sustainable if earnings growth ends up being positive because the estimates started out too optimistic.
The table below shows a different perspective because The Earnings Scout believes investors should now focus on the rate of change of Q4 earnings estimates, not Q3 estimates.
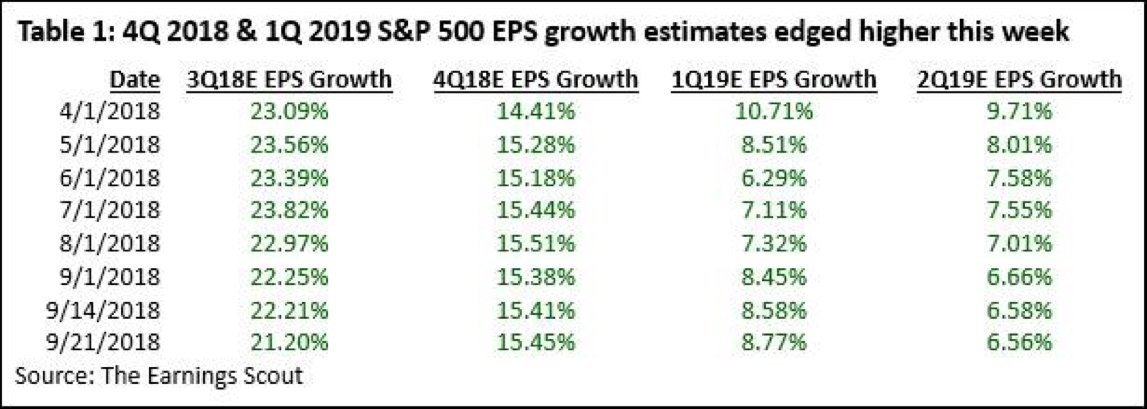
Q3 earnings estimates peaked at 23.82% growth on July 1st and have fallen to 21.2% growth. More importantly, Q4 estimates have gone up 1 basis point in that period. They are down 6 basis points from their August 1st peak, but are up 4 basis points since last week. Q1 and Q2 2019 earnings estimates have fallen because they will face tough comparisons. FactSet shows full year 2019 earnings growth is expected to be 10.3%.
Conclusion
American stocks have high relative valuations compared to the rest of the world and the past. However, earnings growth is still strong as it will likely be above 20% in Q3. Q4 earnings estimates have been rock solid. The only bad news is there haven’t been many positive earnings pre-announcements which is possibly because of the uncertainty caused by the trade war between America and China. Tough earnings comparisons can limit 2019 equity gains, but we need to see declines before we can expect a bear market.
Have comments? Join the conversation on Twitter.
Disclaimer: The content on this site is for general informational and entertainment purposes only and should not be construed as financial advice. You agree that any decision you make will be based upon an independent investigation by a certified professional. Please read full disclaimer and privacy policy before reading any of our content.


