UPFINA's Mission: The pursuit of truth in finance and economics to form an unbiased view of current events in order to understand human action, its causes and effects. Read about us and our mission here.
Reading Time: 5 minutes
It’s hasn’t been surprising to see the Fed’s projections for rate hikes differ from the futures market in this expansion. The interesting part about the current divergence seen in the chart below is that the Fed could be near the end of the hike cycle.
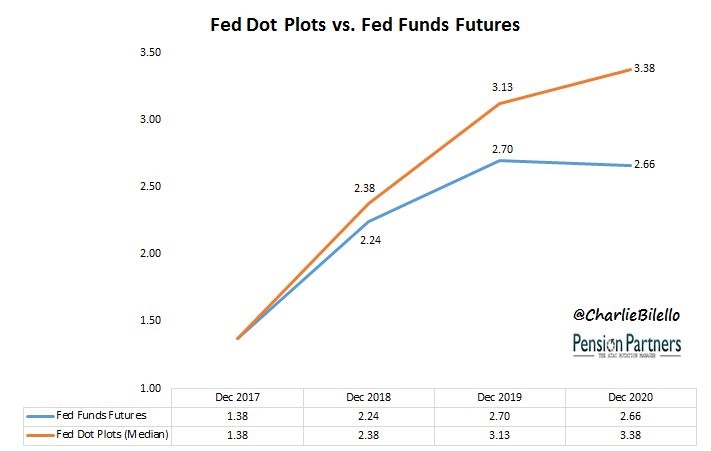
The futures market expects 3 more hikes by 2020, with the hikes ending next year. Since the Fed could hike rates 2 more times this year, there’s only one hike left in the cycle next year. The Fed dot plot projects 6 more hikes by 2020 as there is projected to be one hike in 2020.
It’s not impossible for the expansion to continue until 2020 because inflation is modest and growth has been strong lately. The problem lies with the Fed continuing to hikes rates. With the difference between the 10 year yield and the 2 year yield at 25 basis points, it’s unlikely that the Fed will be able to hike rates 6 more times without an inversion. The 10 year yield has had trouble getting above 3% this year, making a 3% Fed funds rate unlikely. Either the Fed or the market will move to match expectations with projections. We think the Fed projections have a better chance of coming down than the market expectations have of moving up.
No Debt Issuances From The Mega Caps
In late 2017, C&I lending growth stalled to near zero. Usually when growth falls, it’s a recession signal. This was curious because economic growth was strong in the second half of 2017 as that was when global synchronized growth was a reality. Some speculated that C&I lending was a lagging indicator and some said lending slowed because profits were expanding so rapidly. The chart below shows an instance where capital was so readily available, borrowing ceased. As you can see, there has been no debt issued by the 10 largest holders of formerly overseas cash which was repatriated because of the tax holiday.
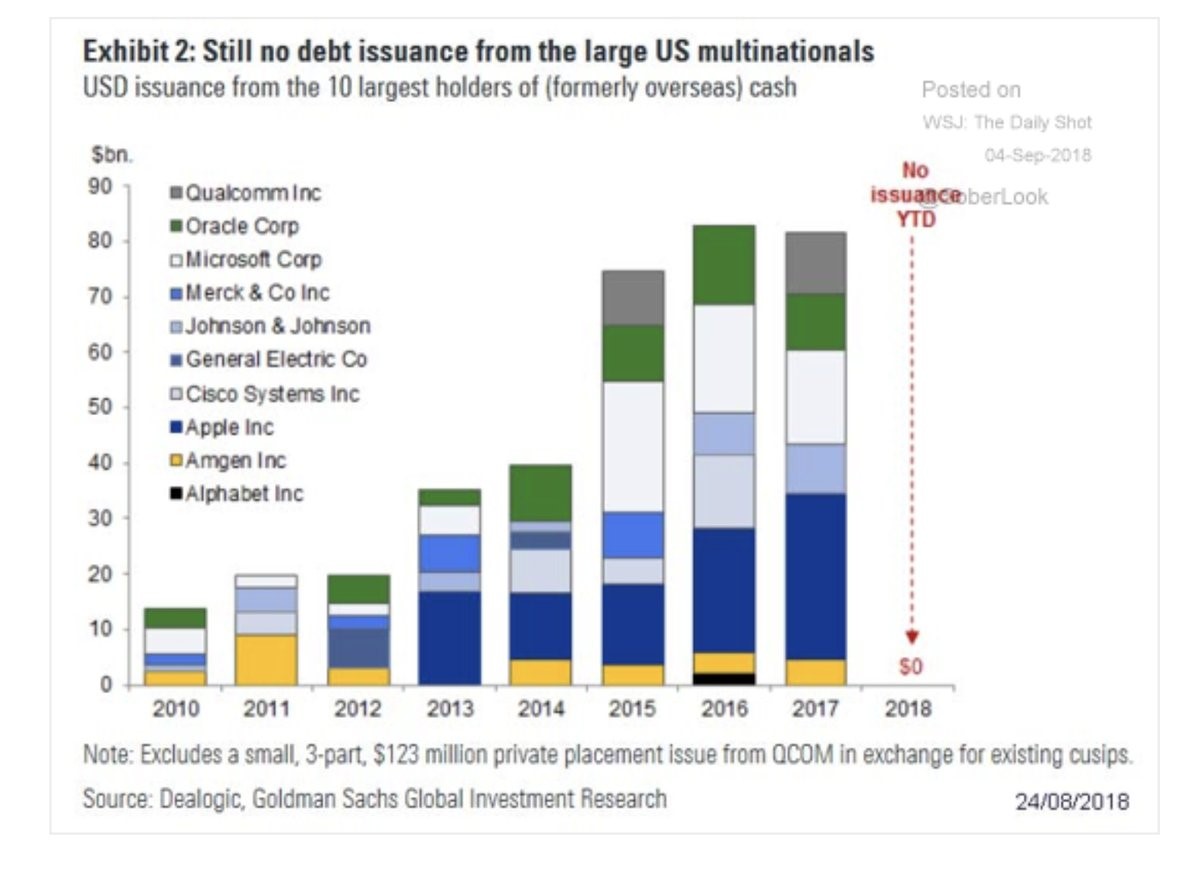
Apple, Microsoft, and Oracle were all big debt issuers because the corporate rate was so low. It was odd to see companies with so much capital issuing debt. This was all to avoid high U.S. tax rates. Most of these firms also have had great profit growth in 2018 partially because of the lower corporate tax rate. When profits increase borrowing can still increase because firms feel it is the right time to expand, but in this case the cash infusion was so large that these mega cap firms haven’t needed to issue new debt.
Earnings Estimates Fall Slightly
2018 has been one of the best years for S&P 500 earnings because growth has been elevated, estimates have been beaten, and estimates haven’t fallen before earnings season. The last trend might be weakening in Q3. As you can see from the chart below, Q3 estimates for earnings growth peaked at 23.82% and have fallen to 22.25%.
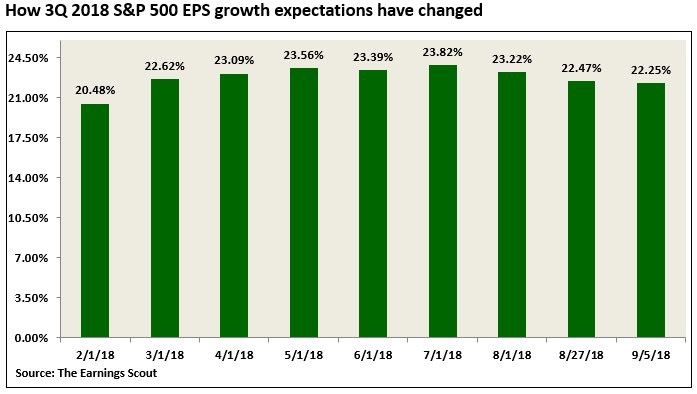
For most of the year, it appeared Q3 would be the peak in earnings growth, but if estimates keep falling in the next few weeks, they may not match Q2 which had 26.45% growth. Investors focused on the bleeding edge of data believe the changes to Q4 earnings estimates tell us where stocks are going even though Q3 earnings season hasn’t started yet. Even though overall growth is lower since it is expected to be 15.38% in Q4, the rate of change looks good as it is higher than August 27th when it was 15.32%. It peaked at 15.61% on August 1st. Earnings growth is expected to decelerate further in Q1 to 8.45% and in Q2 to 6.68%. Difficult earnings comparisons explain the deceleration. As long as earnings grow, stocks still will increase. There doesn’t need to be massive +20% gains for stocks to be in a bull market.
Tech Drives Markets
In a previous article, we showed how tech and tech related firms are driving all the improvements in margins which means the CAPE ratio’s assumption that margins will fall assumes tech margins will decline. The chart below goes even in further in showing the effect tech stocks have had on the global market.
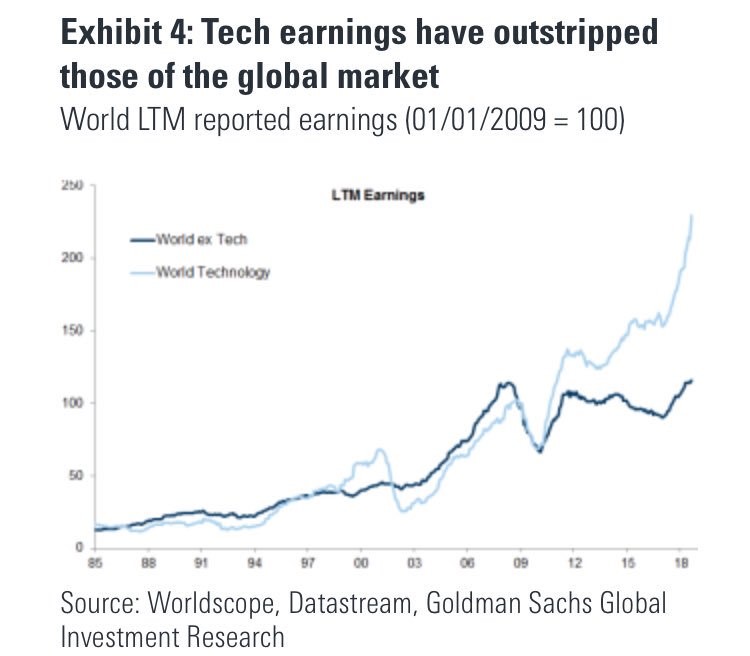
World company earnings excluding tech firms are basically at pre-crisis levels, while tech earnings are over double the level they were at before the financial crisis. Tech is the sole driver of profit growth.
This explains why when deciding to invest in a country’s stock market, it’s important to review the weighting of each sector. Even though you may have done extensive research on the economics of a country, the bet can be a de facto trade for or against technology if you don’t adjust for the country’s sector weighting somehow. This doesn’t mean you shouldn’t invest in countries with a low tech weighting. Just be mindful of what you’re investing into. Another interesting facet this chart brings up is that the regulations which might limit the growth of the major tech names will hurt overall profit growth if the regulations are restrictive. It’s tough to say how this will play out, but it’s a risk factor to be wary of that has broader market implications.
Trade Growth Dropping
As we mentioned, the 2nd half of 2017 was when the global synchronized growth trend was in full force. It has stalled out this year partially because of the dollar rally and rate hikes hurting emerging markets and partially because of the trade skirmishes. As you can see from the chart below, merchandise trade was down in Q2 among G20 nations on a quarter over quarter basis.
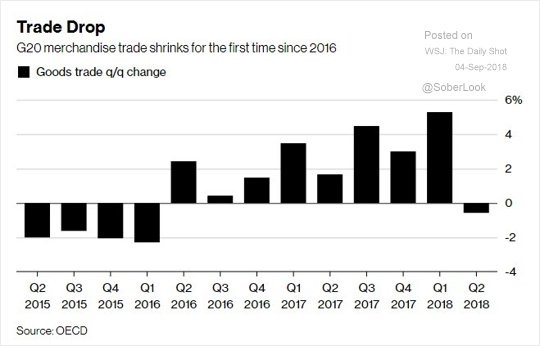
This decline in merchandise trade was the first bout of weakness since Q1 2016 which was the end of the last cyclical slowdown. America hasn’t been a part of the 2018 slowdown yet as Q2 GDP growth was 4.2%. The tax cuts have helped bolster growth.
Conclusion
2018 has been a fantastic year as earnings growth bolstered by the tax cuts have supported U.S. stocks during global economic weakness. There was a sharp deceleration in G20 merchandise trade in Q2, but U.S. stocks haven’t cared as Q2 earnings growth was 26.45%. Tech firms have driven global earnings growth. Since many of the top global tech stocks are in America, it has done well. Unlike the 1990s tech bubble, tech is driven by earnings growth and most firms have reasonable valuations. According to the Fed funds futures market, the expansion is near its end with the Fed rate hikes expected to end in 2019.
Have comments? Join the conversation on Twitter.
Disclaimer: The content on this site is for general informational and entertainment purposes only and should not be construed as financial advice. You agree that any decision you make will be based upon an independent investigation by a certified professional. Please read full disclaimer and privacy policy before reading any of our content.


