UPFINA's Mission: The pursuit of truth in finance and economics to form an unbiased view of current events in order to understand human action, its causes and effects. Read about us and our mission here.
Reading Time: 5 minutes
Retail sales help us understand how well the consumer is as we await the June PCE report, which will be released on July 30th, and the Q2 real consumer spending growth which will be a large determinant of GDP growth. Earnings reports, economic reports such as the retail sales report, economic trend momentum, and estimates of personal income growth accounting for tax cut benefits and wage growth are all used to predict consumer spending. There are a lot of factors that determine help us estimate consumer spending because it is the driving force behind economic growth.
The May retail sales report was great as the results were revised higher across the board. Month over month headline growth was pushed up from 0.8% to 1.3%. Excluding autos, sales growth was up from 0.9% to 1.4%. Excluding autos and gas, sales growth was up from 0.8% to 1.3%. Finally, the control group had 0.8% growth instead of 0.5%. The June report wasn’t as good since headline sales were up 0.5% month over month which met estimates. Excluding autos, sales met estimates at 0.4% growth. Excluding autos and gas there was 0.3% growth compared to the 0.5% growth expected. The biggest month over month miss was the control group which had no growth instead of 0.4% growth. Car sales were up 0.9% in June and 0.8% in May. It’s good to see growth as there has been an overhang ever since the demand was pulled forward after the hurricanes last fall. Cars were destroyed which means people who would have bought cars throughout 2018 had to buy them in 2017.
Restaurant sales were up 1.5% in June and 2.6% in May. It’s encouraging to see the turnaround in restaurant sales shown in the Renaissance Macro Research chart below.
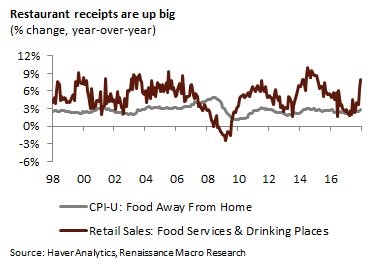
Source: Renaissance Macro Research
The 8% year over year rise in food services & drinking places is a huge turnaround from the weakness seen in 2016 and 2017. Restaurant sales are one of the best recession indicators as people eat from home to save money when their budgets are tight. It ended up being a false recession signal since sales growth has reemerged along with the rest of the economy.
Health and personal care sales were up 2.2% in June. Building materials were up 0.8% and furniture sales were up 1.0%. This is a good signal for household investments. E-commerce store sales were up 1.3% month over month and 10.22% year over year as the segment continues to take share from brick and mortar stores. There’s a strong possibility online and brick and mortar sales become less differentiated as retail stores embrace technology and online stores try to replicate the advantages of being able to see and get a feel for items before purchasing them. We can see this with Wal-Mart’s purchase of Jet.com and Amazon’s purchase of Whole Foods. As we previously mentioned, Physical Retail Stores Are Not Becoming Extent.
The biggest story of this retail sales report is the effect gas station sales had on the number. Gas station sales were up 21.56% year over year and 1.02% month over month because of the rise in oil prices. The chart below shows the extreme volatility in gas station sales as compared to sales at stores without gas.
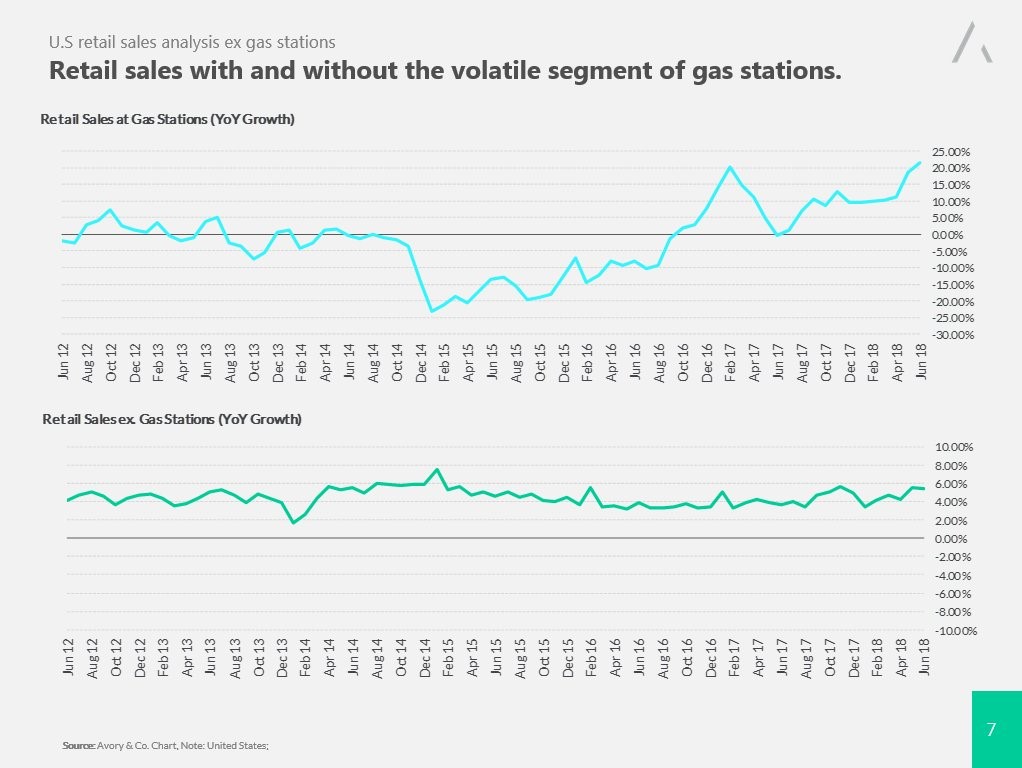
Source: Avory & Company
Even though June month over month control group sales were flat, the bottom chart shows consumer spending growth excluding gas stations looks to be on a similar pace it has been on in the past few years. It’s interesting to see the lack of a decline in 2015 and 2016 as consumers used the savings from gas prices to spend disposable income elsewhere despite the economic weakness.
Energy’s Impact On Industrial Production
The effect of energy needs to be separated from all the economic data because the year over year improvement likely won’t continue. If it does continue, we’ll have a slowdown in economic growth as headline inflation will increase. For now, we need to look at core sustainable growth to see where the economy is headed without the severe vacillations in oil prices. The chart below from ECRI shows year over year industrial production growth is being driven by energy.
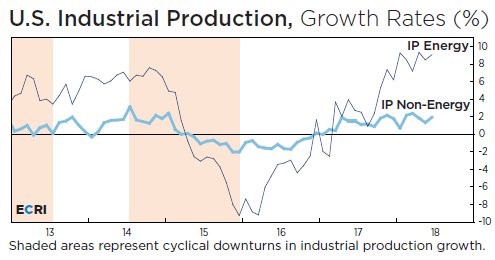
Non-energy industrial production growth is near 2%. This inflation puts a damper on the 47 month high in industrial production and the subsequent strong Q2 GDP growth it will help bring. Another important point about industrial production is that motor vehicle production was stalled by a fire at an auto parts plant in May, causing a subsequent rebound in June. Motor vehicle production fell 8.6% in May and rose 7.8% in June.
Earnings Expected To Fall
The bad news is that S&P 500 earnings growth is expected to fall from 20.6% in 2018 to 10.1% in 2019. The good news is that everyone already knows this, so earnings growth in the high single digits or low double digits in 2019 won’t cause stocks to fall. The expectations are getting negative as seen in the chart below since the percentage of fund managers who say profits will fall in the next 12 months is higher than those who say profits will increase.
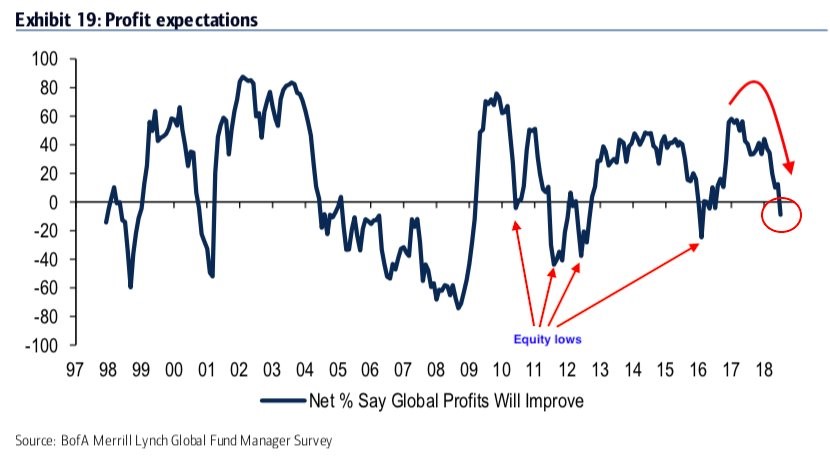
Source: Merrill Lynch
The previous troughs in this chart have been consistent with equity lows, but the stock market is near its all-time high. This same situation existed in 2007 as the bears were proven correct. In this case, the pessimism is caused by tough comparisons, not economic weakness.
Conclusion
We’ll leave you with the chart below which shows the change in global expectations for manufacturing and services since February.
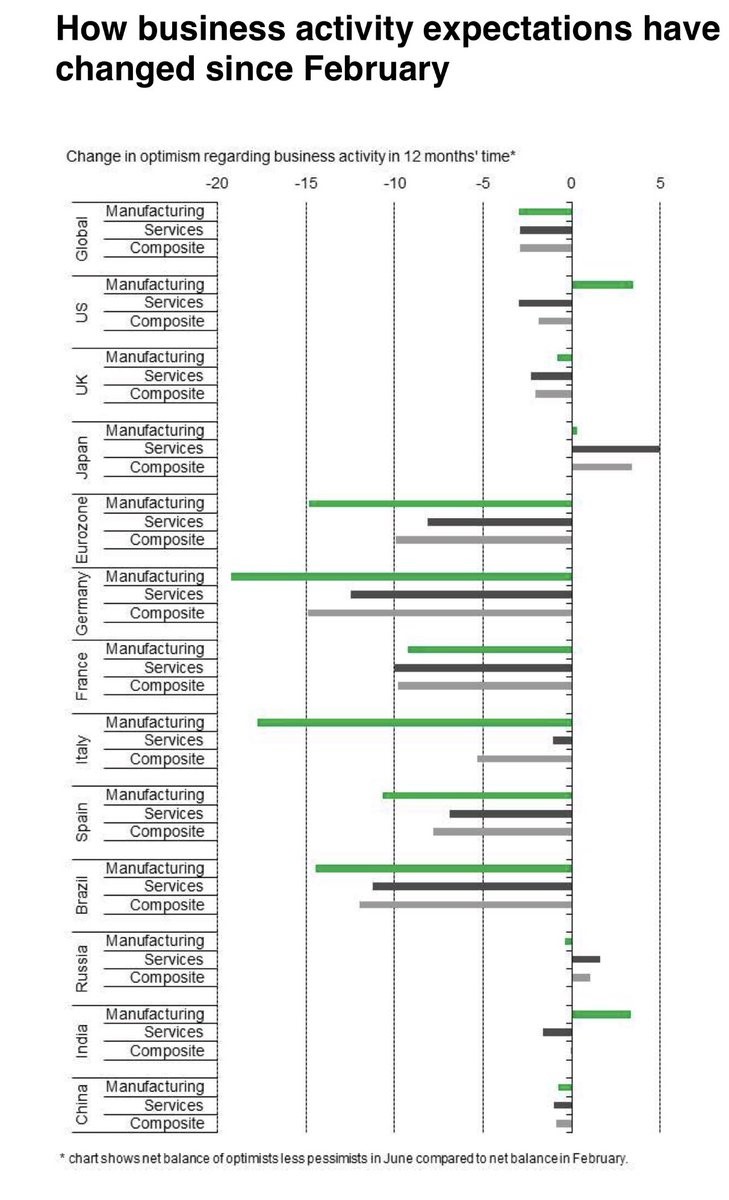
Source: Twitter @JeffreyKleintop
February appears to have been a near term peak in economic performance in Europe. Europe has reduced global growth. Germany’s June composite PMI rebounded slightly which could signal the continent is on its way towards a cyclical turn. You really need to look at the details of reports to find weakness in America. If economic growth continues, it should be a big surprise to those expecting a recession in 2019 due to the flat yield curve. Many investors think profits will fall. If they don’t, stocks could rally even though they are already near their record high.
Have comments? Join the conversation on Twitter.
Disclaimer: The content on this site is for general informational and entertainment purposes only and should not be construed as financial advice. You agree that any decision you make will be based upon an independent investigation by a certified professional. Please read full disclaimer and privacy policy before reading any of our content.


