UPFINA's Mission: The pursuit of truth in finance and economics to form an unbiased view of current events in order to understand human action, its causes and effects. Read about us and our mission here.
Reading Time: 5 minutes
In this article we will take another look at the timing of the business cycle. First let’s review why this expansion has been so long. With Q2 GDP growth potentially reaching above 4% and the stock market near record highs, this expansion looks poised to exceed the length of the 1990s rally. Some believe that the fiscal stimulus in 2018 helped elongate this cycle by a year or two. Others believe the mini recession from mid-2015 to early-2016 eliminated some of the excessive risks in the economy, elongating the cycle. Some believe this business cycle is just getting started because the consumer has actually deleveraged in this expansion. Another explanation is that the financial crisis was so deep, removing so many people from the labor market, it has taken a prolonged time to get people working again. Even after this expansion has lasted 9 years, the labor market isn’t full yet. Stimulative monetary policy where rates were at the zero bound for years also helped avoid a recession. There are many explanations for this long expansion; more than one of them are true.
2 New Cycle Metrics
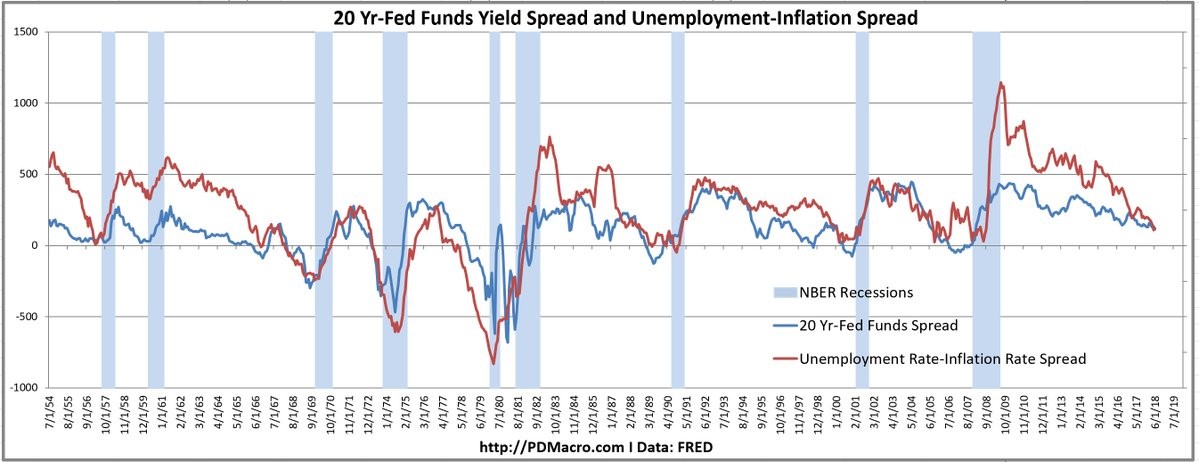
The chart below shows two cycle timing metrics we haven’t reviewed yet which can help us figure out when the next recession will be.
Source: PDMacro.com
They both have a good track record as they usually go negative or close to zero before recessions. The red line is the unemployment rate minus the inflation rate. When the unemployment rate is low, and the inflation rate is high, it’s a sign the cycle is near its end. The unemployment rate doesn’t take into consideration the decline in labor force participation rate which means there could be more slack in the labor market than usual. This would delay the next recession as we mentioned earlier.
The blue line is the spread between the 20 year treasury yield and the Fed funds rate. From 1987 to 1993, there was no data on the 20 year bond, so the average between the 10 year yield and the 30 year yield was used. As you can see, it is getting near the point which raises a red flag for a recession just like the unemployment rate-inflation rate spread.
Present Versus Expectations Index
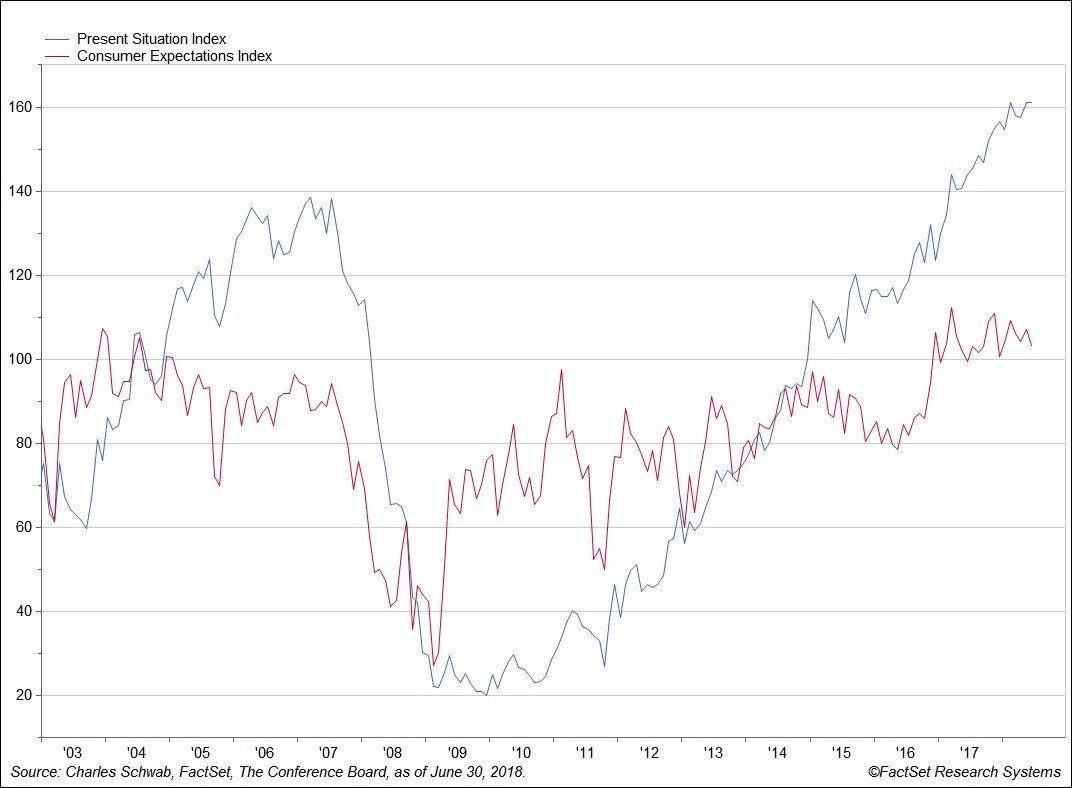
Another new indicator we haven’t reviewed is the spread between the present situation index and expectations index within the consumer sentiment report. As you can see from the chart below, the present situation index exceeded the expectations index in 2006 and 2007, which was right before the financial crisis.
Source: Twitter @LizAnnSonders
The same thing happened in 2015, but then the gap reduced in 2016 as the economy nearly fell into a recession. The gap re-emerged in 2017 and has been large ever since then. This metric is often referred as the “as good as it gets” metric, which indicates the present is better than the future because the economy can’t improve much more. This lasts until higher inflation ends the cycle.
List Of Indicators
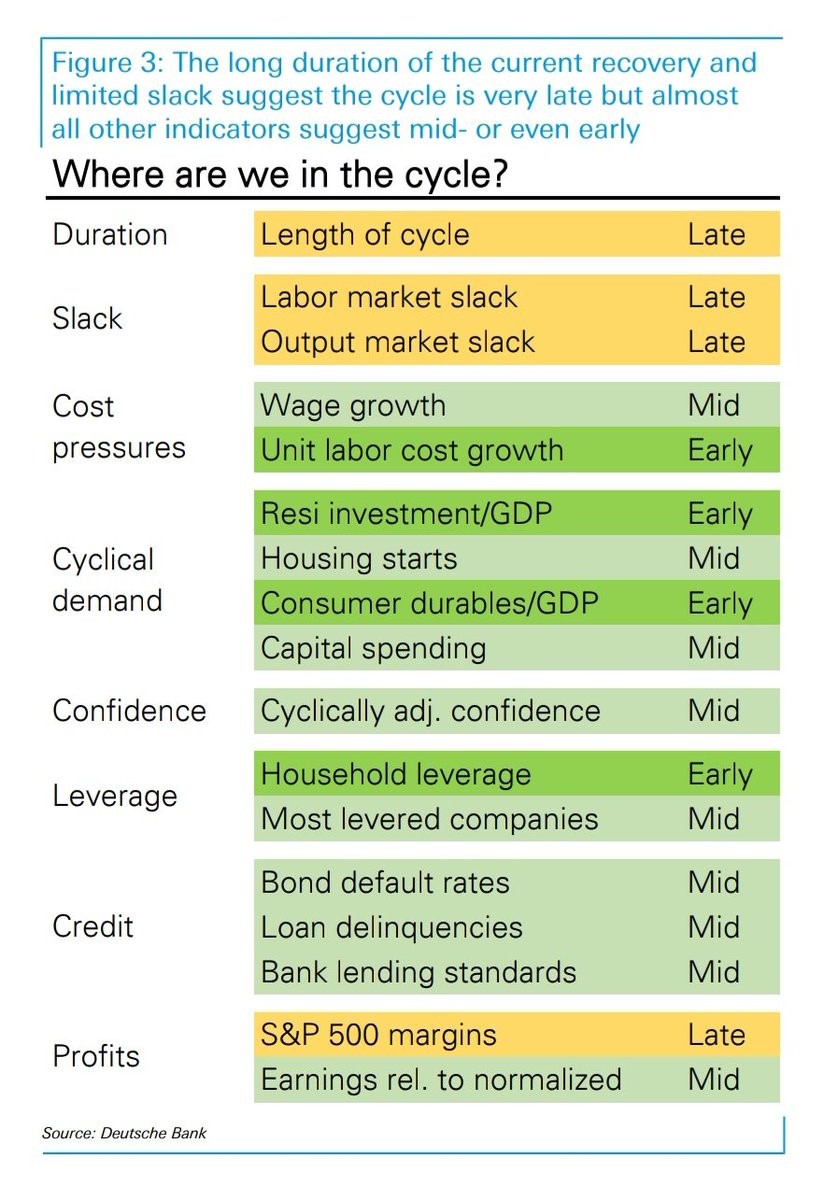
The chart below provides a list of economic indicators and what they are showing.
Source: Deutsche Bank
Four indicators show the economy is early cycle, 9 indicate the economy is mid-cycle, and 4 suggest it is late cycle. This is messy because there isn’t conclusive evidence. However, the truth is always messy. It would be easy for us to only present one side of the argument, but that wouldn’t help readers. Reality is even more complex than this color coded list because the characterization of each indicator depends on which data you review and how you review it.
If you look at the prime age labor participation rate, then the labor market slack is mid-cycle not late cycle. The household leverage shows the economy is early cycle because, as we mentioned earlier, households have deleveraged this cycle. Every few decades there are deleveraging events. It’s possible that households won’t reach peak leverage because that included a housing bubble. Therefore, the deleveraging may not signal the economy is early cycle.
Yield Curve Update
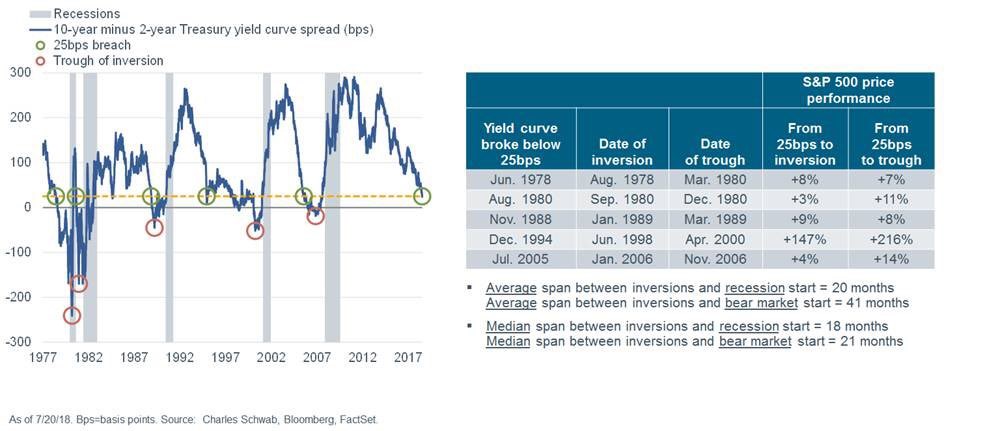
The latest difference between the 10 year yield and the 2 year yield is about 30 basis points which means the economy might be inching its way towards a recession. In 4 of the past 5 cycles, there were only single digit gains from when the curve hit 25 basis points until the inversion. The good news is stocks are also usually positive after inversions. The bad news is the clock starts on the next recession as the median length from an inversion to a recession is 20 months. The data under the chart shows when the average and median bear markets come, but the reality is bear markets can come at any point in this period where a recession is about to happen.
Source: Charles Schwab
Real Fed Funds Rate
The real Fed funds rate is a cousin of the yield curve. It indicates whether the Fed is expansionary or contractionary in a crude manner. It’s crude because inflation doesn’t determine which policy the Fed has. The rate of change of inflation and growth tell us where the Fed is. For example, there is a big difference between rate hikes which are trying to slow rising inflation and rate hikes which have already slowed inflation. The chart below shows the real Fed funds rate has been positive before every recession except one.
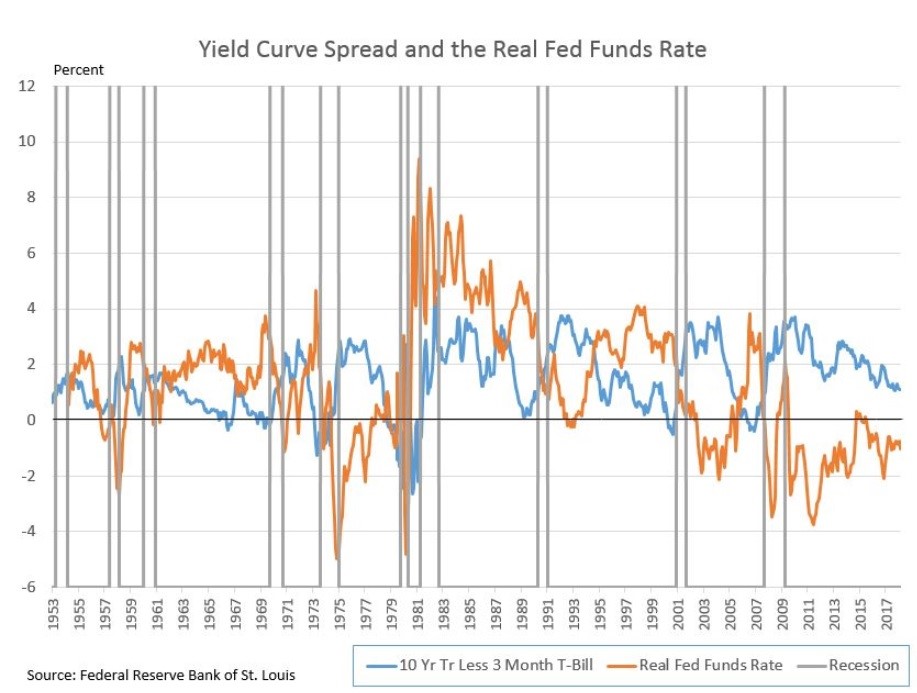
Source: Indexology Blog
Since the real Fed funds rate is -1%, this indicator is far from signaling a recession. The Fed needs to raise rates 5 more times and inflation needs to be steady for the indicator to raise a red flag. Even with 2 more hikes this year, the indicator won’t get close to being problematic unless inflation starts to falter.
Conclusion
Even though economists have been saying the economy is late cycle for a few years, most indicators don’t show it is late cycle. Some indicators even show the economy is early cycle. The risk of a recession in the next 12 months is low when looking at both the yield curve and the real Fed funds rate. This recession timing story is about whether one will occur in late 2019, 2020, or 2021.
Have comments? Join the conversation on Twitter.
Disclaimer: The content on this site is for general informational and entertainment purposes only and should not be construed as financial advice. You agree that any decision you make will be based upon an independent investigation by a certified professional. Please read full disclaimer and privacy policy before reading any of our content.


