UPFINA's Mission: The pursuit of truth in finance and economics to form an unbiased view of current events in order to understand human action, its causes and effects. Read about us and our mission here.
Reading Time: 5 minutes
Since the economy is in the late stages of the business cycle, inflation is the most important economic metric to watch. If inflation spikes, the Fed theoretically needs to raise rates to reduce growth. If inflation gradually increases, the Fed can slowly raise rates and stave off a recession for a while. It’s not a coincidence that this economic cycle has had low inflation and it is very close to being the longest expansion since 1854.
The Fed follows the core PCE report the closest which means it is the most important metric to follow. Forget about whether you agree with the measurement or not because we’re mainly using it to forecast Fed policy. With the labor market tightening and commodity prices rising in April, some expected inflation to spike. However, the month over month PCE price index was up 0.2% which met the consensus estimate. That’s above the flat growth in March. Year over year PCE was up 2% which also met estimates and was the same as last month. Month over month core PCE was up 0.2% like last month which beat estimates by one tenth. The year over year core PCE, which the Fed uses to set policy, was 1.8% which met estimates. Last month’s core PCE was revised down from 1.9% to 1.8%. This data is interesting because the Fed had said in its Minutes that it would allow inflation to get above 2% for a bit without raising rates quickly. Now that seems like an overzealous point to make as inflation remains below its 2% target.
Will Housing Prices Continue To Increase?
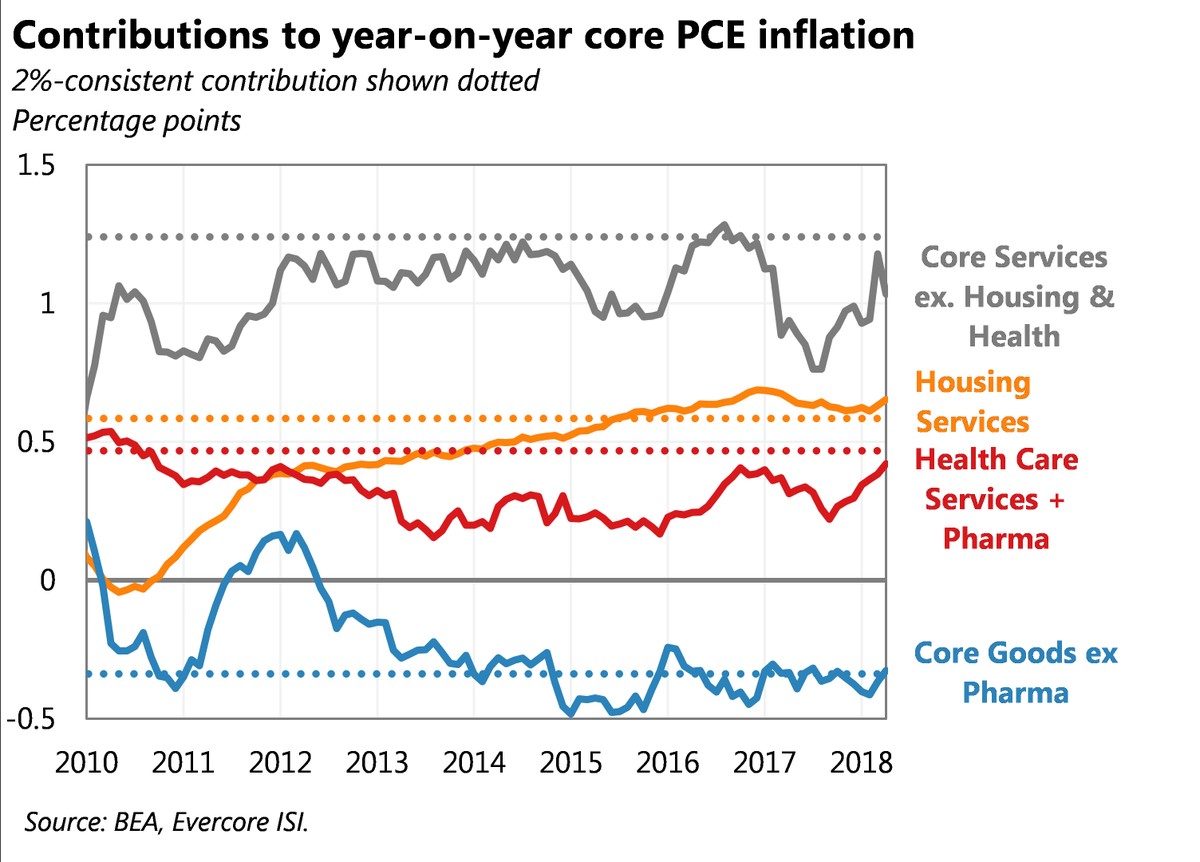
The chart below from Ernie Tedeschi shows where each category of core inflation needs to be to get core PCE to 2%.
Source: Twitter @ernietedeschi
The dotted lines are color coded to show which segment needs to get to that rate. The housing services category is the only one which has been above its dotted line consistently for the past few years. Technically, since the Fed wants inflation to increase to get to its goal, it will be easier for housing values and costs to continue to increase since shelter seems to be the most likely segment to drive inflation higher based on the recent past.
We’re not blaming the Fed for this crisis in its entirety because zoning restrictions are a large driver locally of housing prices as well since they restrict supply. We’re pointing out how difficult the Fed’s job is to set policy since it doesn’t control inflation. For example, if a more market based approach to healthcare lowered costs, inflation would fall regardless of where interest rates were. The Fed wanting components of the core PCE to become more expensive just points out the illogical nature of inflation targeting, whether it be applied to housing, pharma or any other costs. Inflation is a negative which tends to come along with economic growth but also of course from Fed policy and currency creation. The goal should be to maximize growth while keeping inflation as low as possible (0% or less). Even if the Fed did achieve a steady 2% inflation rate, that is a guaranteed decline in the purchasing power of the currency.
Where Is Inflation Headed?
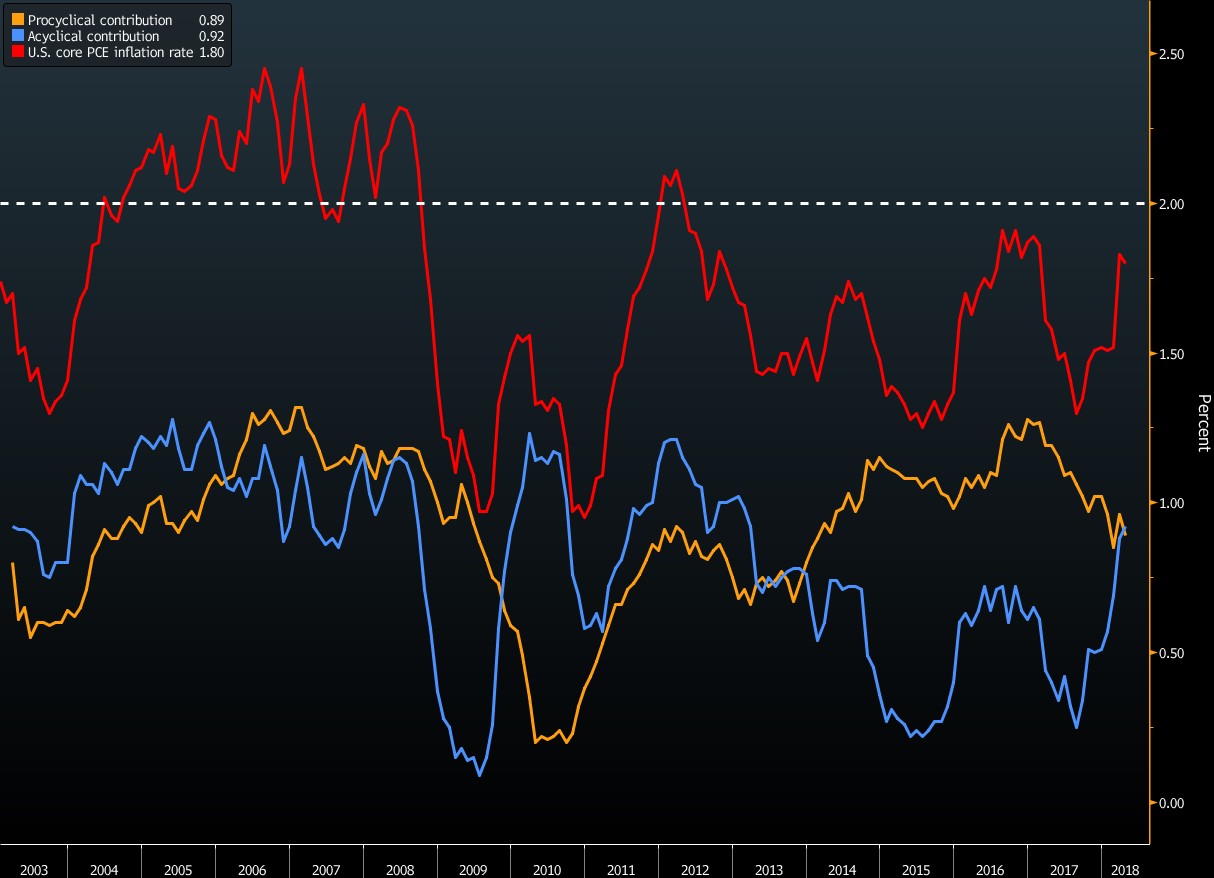
Even though industrial production and consumer spending were strong in April, inflation didn’t meet the Fed’s 2% target. This leads us to the most important question investors need to answer which is: “where is inflation headed next?” The Bloomberg chart helps to answer that question as it shows the core PCE along with the procyclical and acyclical inflation rates.
Source: Bloomberg
Procyclical inflation is the rate that moves along with the trajectory of the economy and the acyclical inflation has no correlation to the economy. This is important because the procyclical inflation should be rising now since the economy is growing quickly. However, the chart shows procyclical inflation is falling. The acyclical inflation has been driving inflation up recently. It’s difficult to expect acyclical inflation to stay high when there’s no economic argument for it to do so. If procyclical inflation was where you’d expect it to be based on the strength of the economy, inflation would be much higher than the 2% target since the acyclical inflation is high.
Procyclical Conundrum
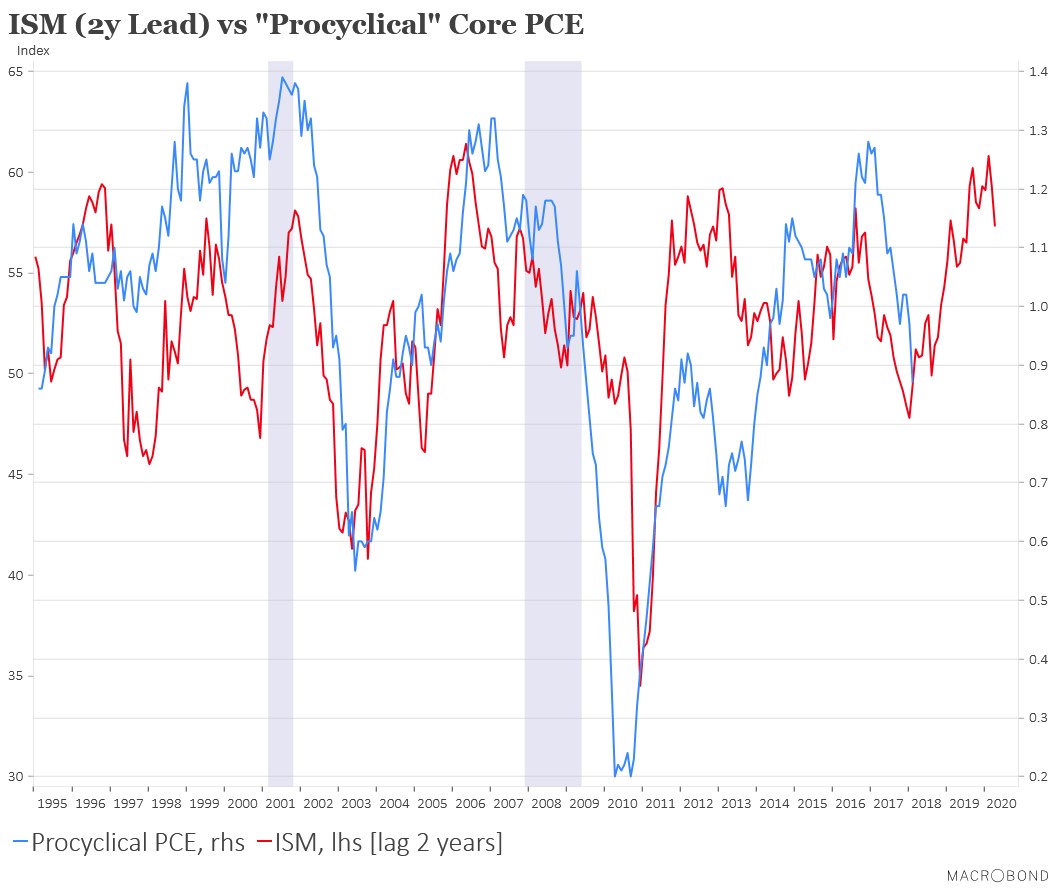
We are trying to figure out when procyclical inflation will become correlated with economic growth again since Q2 GDP estimates are high while it falls. The Macrobond chart below shows an interesting suggestion as to where it is headed.
Source: Macrobond
The chart compares procyclical inflation with a ISM lag of 2 years. Essentially, the concept is procyclical inflation lags economic growth by 2 years. The chart suggests procyclical inflation will pick up shortly since economic growth was strong in 2017.
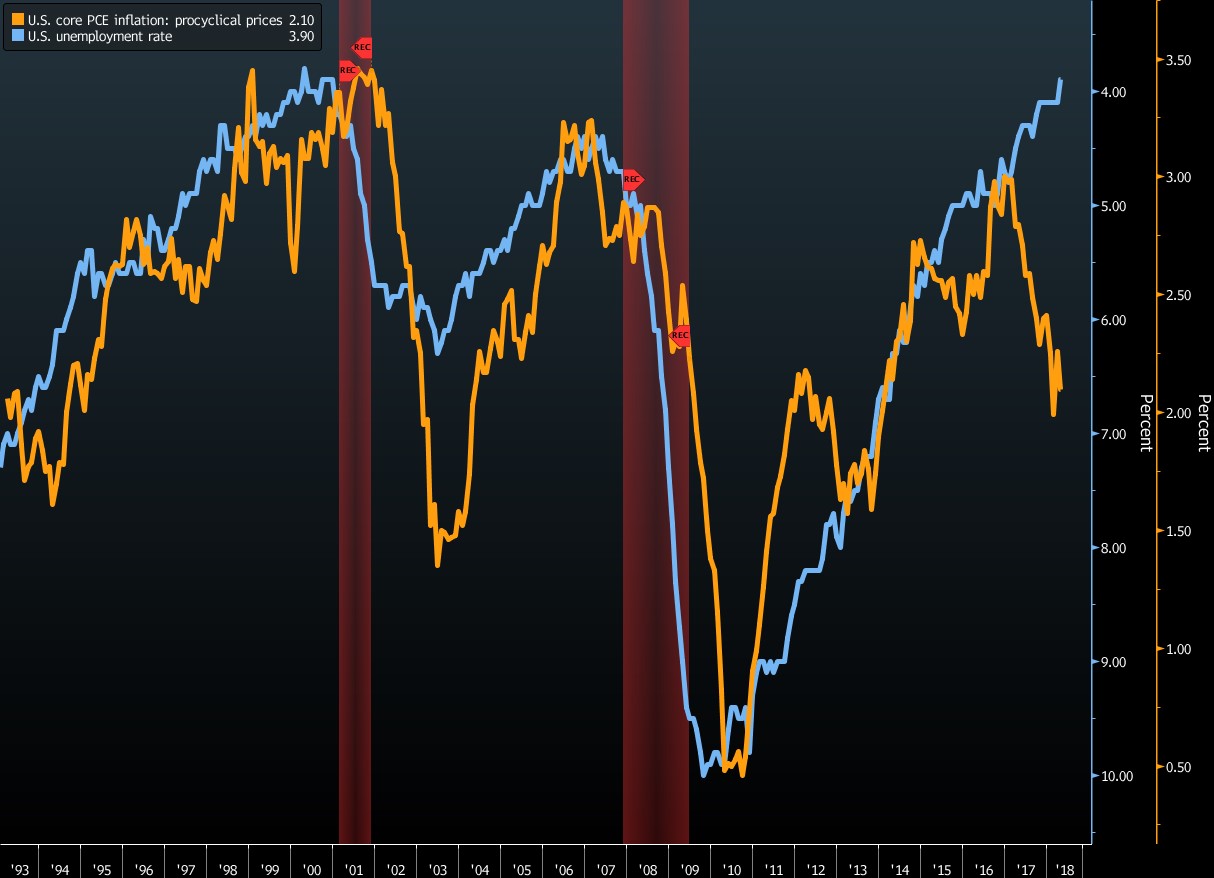
The Bloomberg chart below compares the procyclical inflation rate with the unemployment rate inverted.
Source: Bloomberg
The inflation rate had reliably correlated to this metric until the past 18 months. There have been other situations where the correlation temporarily broke, but it reverted shortly afterwards. That’s suggesting the same thing as the prior chart which is that core inflation will be headed above 2% in the next few months if the acylical inflation rate stays high.
The U3 unemployment rate is far from a perfect measure of the labor market, but it gets the job done in the prior chart because it accurately shows the trajectory of the economy. It’s debatable if the labor market is actually full now just because the U3 rate is at 3.8%. The Bloomberg chart below shows the U6 rate which adds the part time and marginally employed workers to the U3 rate.
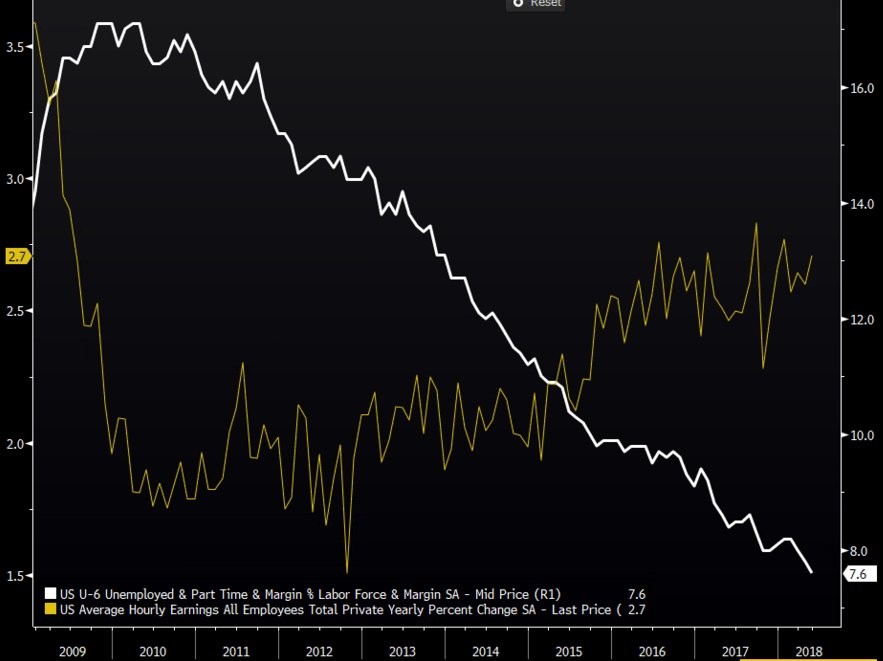
Source: Bloomberg
This chart suggests that there has been wage growth resulting from the tightening labor market, meaning there should be more procyclical inflation than there is. The peak wage growth rate so far has been disappointing, but the trajectory is up which hasn’t been matched by the procyclical inflation at least temporarily.
Conclusion
Inflation can be broken down so many different ways. We showed the categories of the core PCE report and the difference between acyclical and procyclical inflation. Heightened economic growth along with the tightening (but not full) labor market suggest core PCE should increase moderately this year. The goods news for equities is the current situation remains a Goldilocks one as growth is strong and inflation is modest. Further good news is if inflation picks up slightly above 2%, as we anticipate, the Fed won’t raise rates quickly as we covered in a previous article, providing an elongated positive environment for stocks.
We have previously covered the topic of inflation as we foresaw it heading into 2018. Here are some of the previous articles that you may be interested in:
- Growth & Inflation Are Not The Same
- Price Inflation Distribution Is Not Uniform In US
- Long-Term Inflation Pressures
- Why Inflation Will Increase In 2018
Have comments? Join the conversation on Twitter.
Disclaimer: The content on this site is for general informational and entertainment purposes only and should not be construed as financial advice. You agree that any decision you make will be based upon an independent investigation by a certified professional. Please read full disclaimer and privacy policy before reading any of our content.


