UPFINA's Mission: The pursuit of truth in finance and economics to form an unbiased view of current events in order to understand human action, its causes and effects. Read about us and our mission here.
Reading Time: 5 minutes
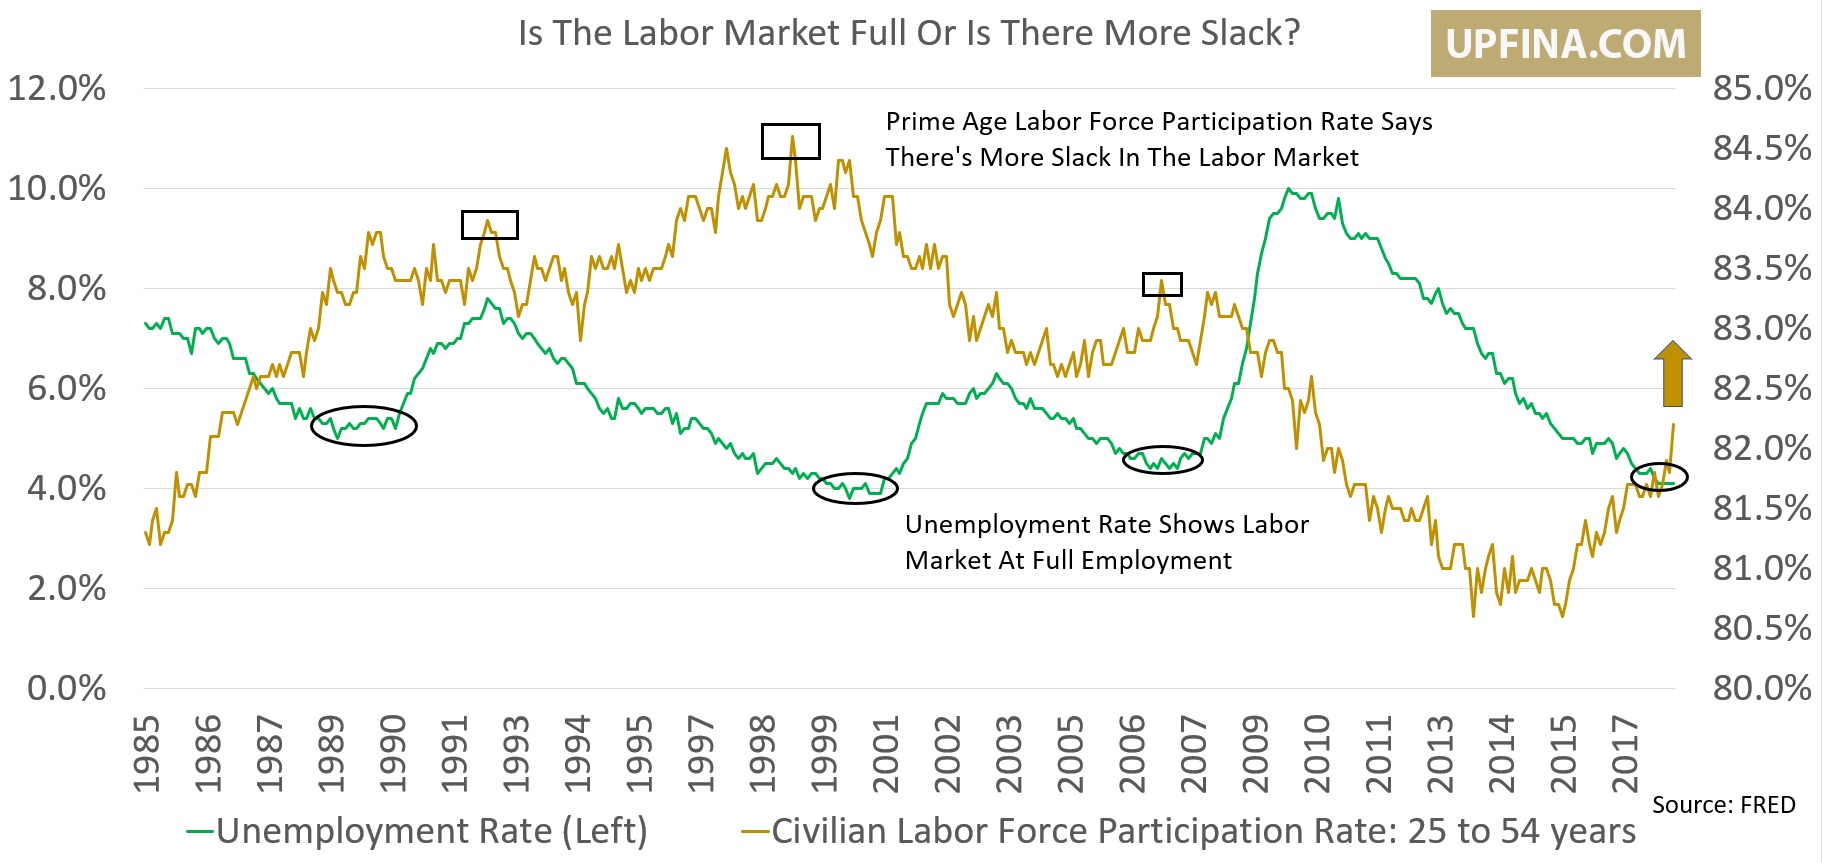
This expansion has had slow real wage growth which has led many economists and investors to re-evaluate what drives wage growth. If you think supply and demand of labor drives wage growth, then recognize that the employment participation rate for prime age workers still signals there’s slack in the labor market.
Labor Market Full?
Others think GDP growth is the only thing that can drive wage growth because Japan has had a low unemployment rate without much wage growth.
S&P 500 profits are at a record high partially because margins have improved. This improvement has come because of low wage growth. There needs to be economic growth driving revenues even higher to allow profits to remain high while workers get a pay hike. A tight labor market certainly helps wage growth as well.
We’re basing our analysis on the medium term trend in official government wage growth stats, but other indicators suggest wage growth is actually thriving. The chart below from Bloomberg shows the latest small business jobs report from the NFIB has the net share of small businesses raising labor compensation at a record high.
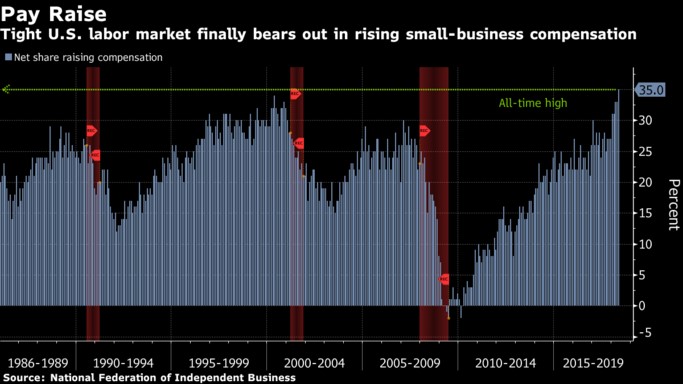
Source: Bloomberg
Small businesses are having trouble finding qualified workers and are therefore offering higher pay. Cyclically this is bad news because when wage growth has been high in the past, the Fed has raised rates and a recession came soon afterwards. As you can see, wage growth peaked about a year before the last two recessions. There’s no telling when it will peak this cycle, but since we’re at a record, it’s fair to assume we’re close to the peak.
Latest Personal Income & Spending Numbers Are Solid
We mentioned that the wage growth hasn’t been up to expectations this cycle. However, the recent data from the April Personal Income & Outlays report was very positive. The personal income growth was 0.3% month over month which was one tenth better than last month. This met expectations. The wages and salaries growth was even better as it was up 0.4%. The chart below from Econoday shows the month over month and year over year disposable income growth.
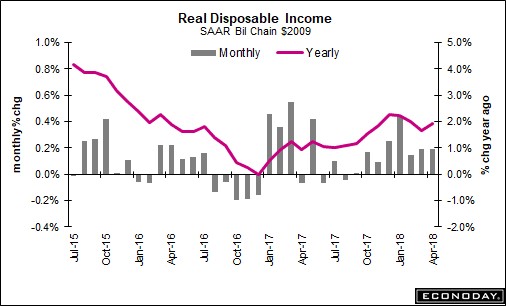
Source: Econoday
The income growth has recovered from its decline which ended in December 2016. This report isn’t as optimistic as the NFIB survey, but it’s good news. Higher wage growth isn’t bad for stocks if we’re seeing improved consumer spending and low inflation.
We’re certainly seeing strong consumer spending as this report showed a 0.6% month over month growth rate which beat expectations for 0.4% growth. This report led to big improvements in the Q2 GDP growth estimates. Before we get to those, let’s throw some cold water on this great number. Firstly, this boost in spending was driven by higher gas prices. There was a 0.9% gain in non-durable spending. It’s good to see spending do well even as gas prices are rising, but don’t think all this money is going to retailers. The growth could decline if gas prices fall. Secondly, the consumer spending growth came partially from savings as the personal savings rate fell from 3% in March to 2.8% in April. Obviously, that’s not a great sign because there’s little room for the savings rate to fall further. The record low is 1.9% in July 2005.
Improved Consumption Means Strong Q2 GDP Growth
The GDP report and the current estimates don’t care about the context of the report which is a mixed bag. The numbers are simply plugged into the formulas and a projection is made. To be clear, context is important because it helps us determine the sustainability of the trends being reported. The GDP growth for Q2 looks really good because the industrial production and consumer spending reports were strong in April and the soft data reports signal the trends will continue in May.
The CNBC GDP growth tracker is now at 3.7% with 10 estimates included in that average. As you can see from the chart below, the Atlanta Fed GDP Nowcast shows growth will be 4.8%.
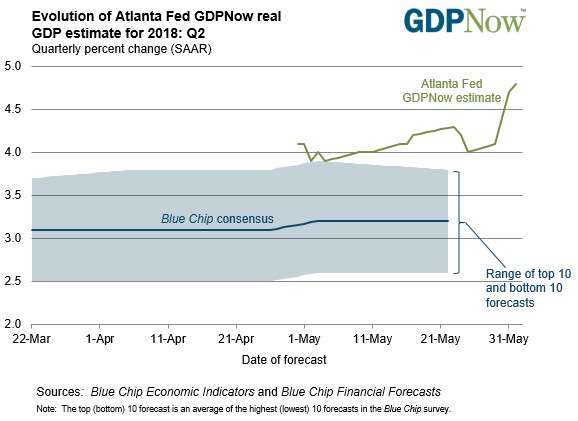
Source: Atlanta Fed
The increase from 4% to 4.7% in a previous update was partially driven by the consumption report we just reviewed which pushed up the estimate for real consumer spending growth from 3.2% to 3.4%. This is a great turnaround from the Q1 GDP report which showed 2.2% growth; it was brought down by the 1% growth in consumer spending.
The naysayers will claim the Atlanta Fed Nowcast we’ve reviewed isn’t reliable because it showed growth would be very high last quarter. That’s the wrong perspective because that was very early in the quarter before any hard data reports had come out. Now we have the data for the first month of the quarter in the books and the estimate is very optimistic. We’re not saying growth will necessarily be 4.8%, but that’s one estimate of where we stand based on the data which has been reported so far. It’s correct to say May was a great month for the economy.
Conclusion
The latest trend we have pointed out in previous articles has maintained itself. The U.S. economy is outperforming the other advanced economies. This is causing the dollar to go up which is hurting emerging markets. America is the only game in town. The S&P 500 would join the Russell 2000’s record performance if the uncertainty over tariffs, and Italian politics were to abate. Tensions have pushed the market lower while the strong economic data has pushed the market higher. Italian tensions actually look like a possibility to abate as the right wing political parties agreed to a compromise on who they selected as the economy minister. The tariff situation looks uncertain as Trump just levied his originally announced steel and aluminum tariffs on Mexico, Canada, and Europe after there was a delay for negotiations. Those countries will be countering them with tariffs on America. It’s important to understand these counterbalances before making the claim that the economic fundamentals don’t matter because stocks are only up about 2% year to date.
If you are interested in reading more articles on the topic of economic growth and inflation, check out:
- Growth & Inflation Are Not The Same
- US Economic Growth Pushes Yields Higher
- Will This Be The Longest Business Cycle In History?
Have comments? Join the conversation on Twitter.
Disclaimer: The content on this site is for general informational and entertainment purposes only and should not be construed as financial advice. You agree that any decision you make will be based upon an independent investigation by a certified professional. Please read full disclaimer and privacy policy before reading any of our content.


