UPFINA's Mission: The pursuit of truth in finance and economics to form an unbiased view of current events in order to understand human action, its causes and effects. Read about us and our mission here.
Reading Time: 5 minutes
The U.S. economy is driven by the consumer as about 2/3rds of GDP is consumer spending. To forecast where the economy is headed, you need to figure out the health of the consumer. One of the main inputs to this forecast is the labor market (the other one being credit). There are a few gauges of the labor market which will be reviewed in this article. This business cycle has been unique because of the lack of wage growth despite the low unemployment rate. The other unusual aspect is the jobless claims report which is showing similar results to the 1970s despite growth in the labor market.
The principal way most investors and economists measure the labor market is the Bureau of Labor Statistics monthly non-farm payrolls report. The report for May 2017 was terrible which was somewhat unusual if you compare it to the past few quarters of reports, but is consistent with the downward trend (negative rate of change) if you look at it on a year over year basis as is shown in the chart below. The report was bad because of a few reasons. Firstly, the headline number was 138,000 jobs created which was below expectations of 185,000 jobs. This was below the expectations of 83 out of 84 economists. Also, the past two months of reports were revised lower by 66,000 total jobs.

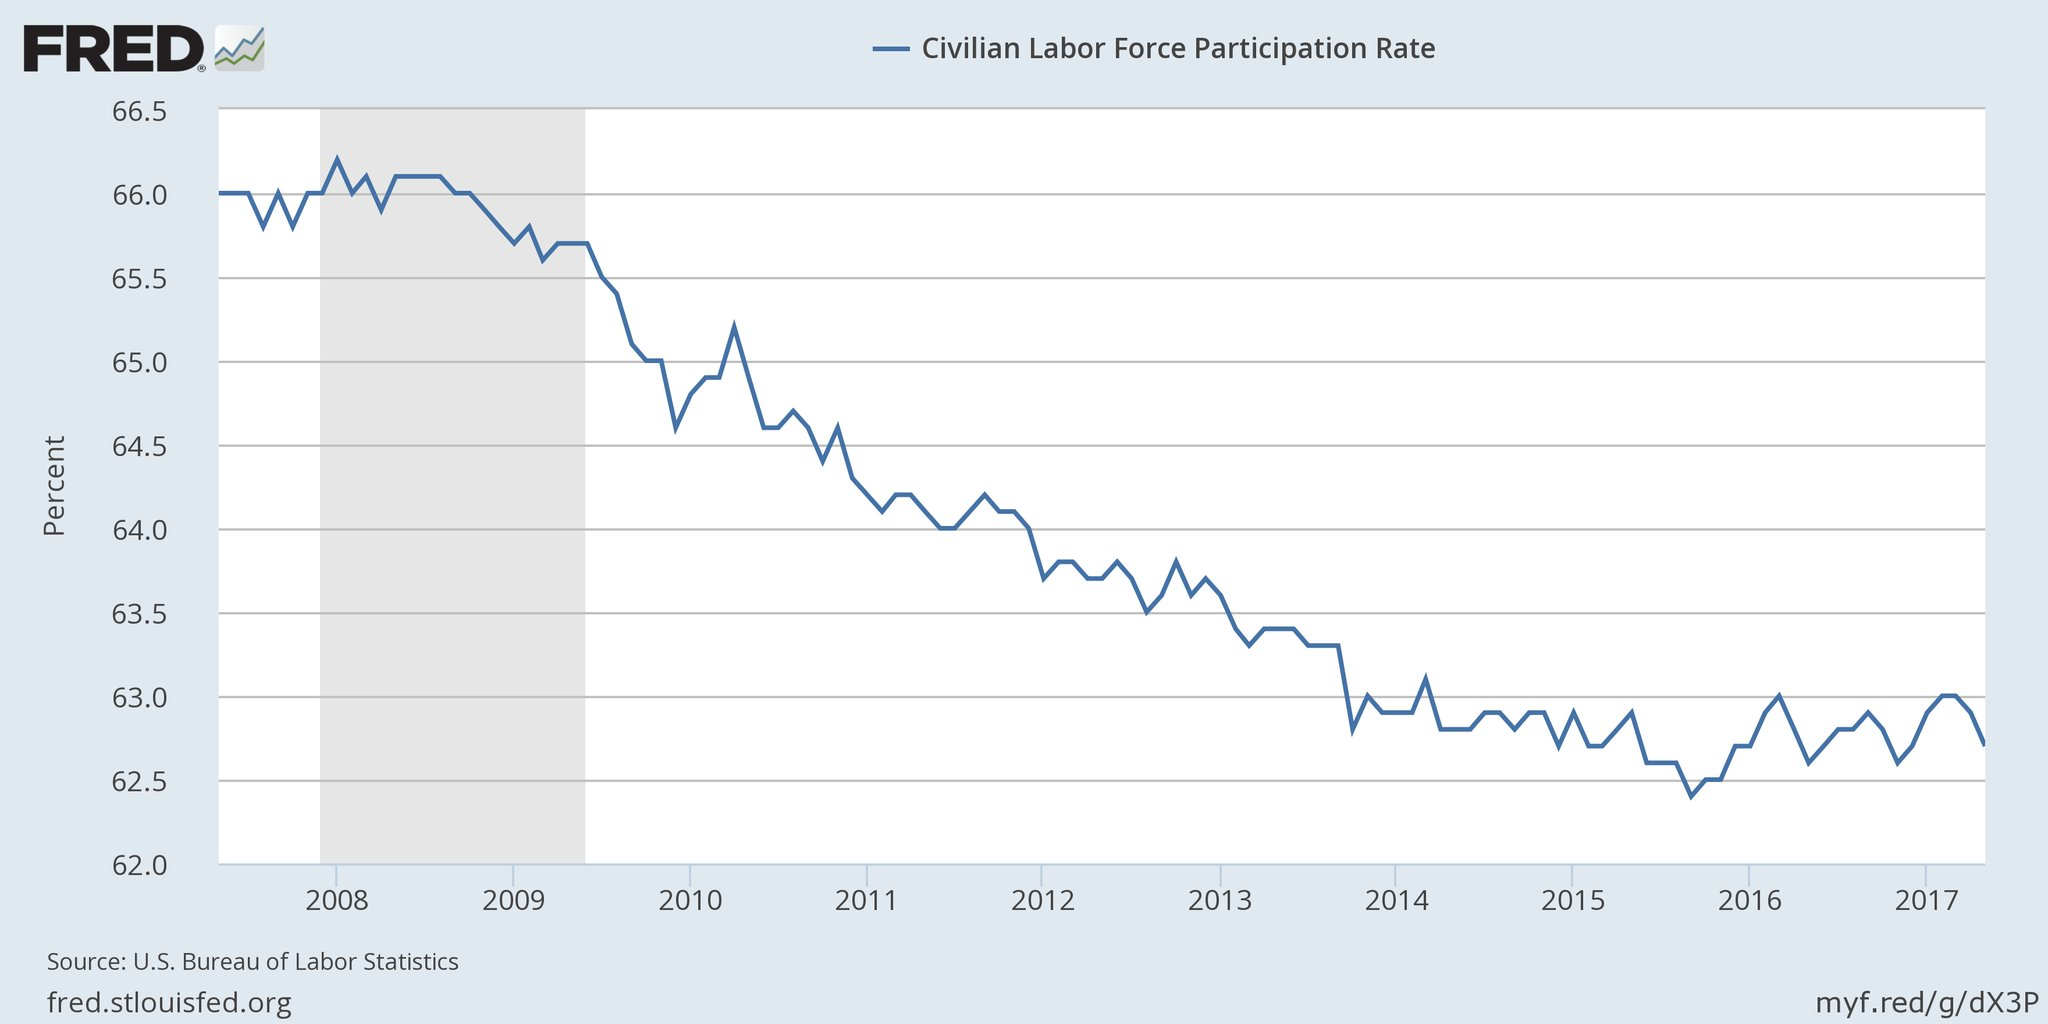
The chart above shows how hourly earnings growth is now stagnating at 2.5% year over year. The work week length didn’t change, so the growth in weekly earnings was the same as the hourly earnings growth. As you can see, before the financial crisis, the hourly earnings growth was above 3%. This is the norm for most business cycles because at the end of the cycle, there aren’t as many workers to fill the jobs available. That hasn’t been the case this cycle as the unemployment rate has fallen to 4.3%, yet there’s not much wage inflation. Part of the reason for this is the weakness in the labor participation rate which you can see in the chart below. The labor participation rate looks worse than it is because of the aging population. However, it should be at about 63.5% adjusted for demographic changes, not 62.7%.
There may be a large swath of workers who had given up on finding a job in the past few years and then decided to re-enter the labor market based on news reports of how great the labor market is and optimism surrounding the election of Trump. Those workers who tested the labor market appear to have left it again as the labor participation rate fell two tenths of one percent and 608,000 American workers exited the labor force in May. The labor force declined by 429,000. The number of employed people fell by 233,000, so don’t let the decline in the unemployment report and the positive job creation headline confuse you. The worst part of the report is that there were 133,000 net new part time jobs and 367,000 net less full-time jobs.
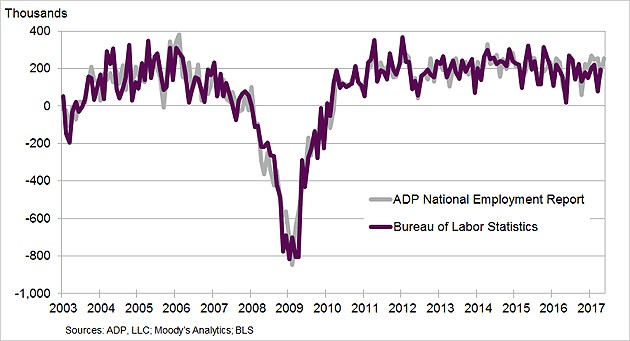
The BLS report is just one reading of the jobs market. An alternate popular gauge of the labor market is the ADP National Employment Report. The May reading was great. This is just like how March had a disappointing headline number in the BLS and the ADP report was great. May’s ADP report showed 253,000 jobs created. The chart below breaks down the historical reports from both places. As you can see, differences occur sometimes, but they’re highly correlated. Neither report was ahead on the last recession, so it’s not wise to suggest the ADP report is lagging the BLS number. Either the ADP report will fall next month or the BLS report will rebound like it did in April. It’s interesting to see the ADP report showing small businesses hiring 83,000 workers because the S&P small caps have seen declining margins. There isn’t any data on small business margins because they aren’t public, so that point assumes the small cap firms and small businesses’ margins are correlated.
As was pointed out in the introduction, the jobless claims are showing very low numbers relative to the population. The 4-week moving average for continuing jobless claims fell to 1.91 million which is the lowest since 1974 which is strange because the labor force population has increased since then. This strength is consistent with the unemployment rate, but inconsistent with the wage growth. It’s possible that the jobless claims metrics are being altered by the gig economy. This new economy represents workers at Uber and Postmates as well as other freelancers. These workers likely aren’t seeing the wage gains a regular employee would see because the workers are distant from the company and don’t have much room to be promoted. The benefit of having this job is that it’s difficult to run out of work. It’s possible a worker in the traditional economy falls back on this work when he/she loses her/his job instead of filing for unemployment.
A non-traditional measure of the labor market is the Help Wanted Online Data Series put out by the Conference Board. The indicator, seen in the chart below, measures the total online job ads.
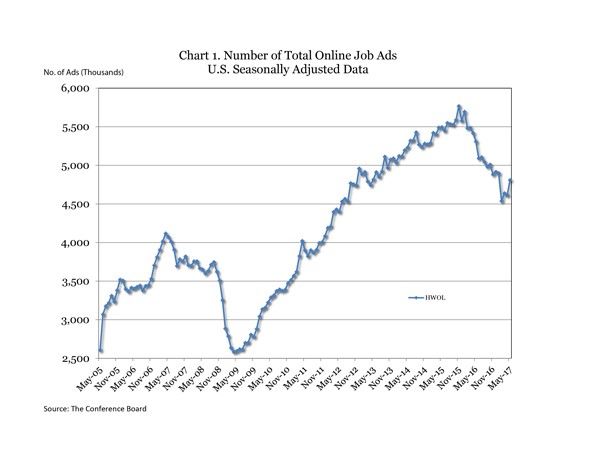
This indicator is seeing a similar decline to the one during the recession in 2008. Either this indicator is early in forecasting a recession or it’s wrong. It’s possible the dynamic of the online freelance economy has changed. Uber and Postmates have grown. They employ a business model which is always looking for workers. This isn’t like when Verizon puts out a help wanted ad to fill a specific vacancy. Uber can always use more drivers. Keep in mind this is only a theory about why the indicator has diverged from others. The Conference Board is researching why the indicator has gone rogue.
Conclusion
The Federal Reserve and economists were waiting for the great job creation growth to translate into wage gains. Instead of seeing wage growth acceleration, they were smacked in the face with a disappointing BLS jobs report. I think some of the workers who are discouraged temporarily came back into the labor market and are now leaving because they couldn’t find a job. There’s a large swath of millennials who haven’t been able to get a job in their field of study.
Have comments? Join the conversation on Twitter.
Disclaimer: The content on this site is for general informational and entertainment purposes only and should not be construed as financial advice. You agree that any decision you make will be based upon an independent investigation by a certified professional. Please read full disclaimer and privacy policy before reading any of our content.


