UPFINA's Mission: The pursuit of truth in finance and economics to form an unbiased view of current events in order to understand human action, its causes and effects. Read about us and our mission here.
Reading Time: 5 minutes
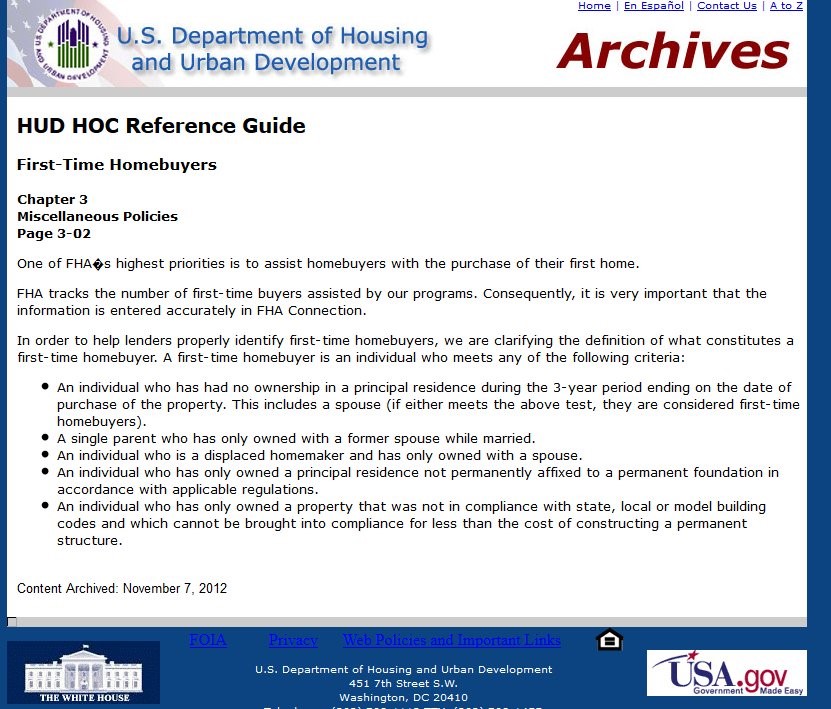
When determining the direction of the housing market, analysts like to look toward the millennial generation to provide future demand. The most common age in America is 27. The average age of first time home buyers is 33 which implies there will be a surge in housing demand in the next few years. While there will be an increase in housing demand, an interesting fact worth reviewing is the definition of a first time home buyer according to the government. While you may think a first time home buyer is someone who never owned a home, that’s not what the government views as a first time buyer.
As you can see from the screenshot of the U.S. Department of Housing and Urban Development website, a person who had no ownership in a principal residence during the 3 year period before the purchase of a house is considered a first time home buyer.
Someone can be a first time home buyer 10 times in their life in theory. Given that there are 5 extra ways someone can be a first time buyer besides being a first time home owner, the average age of home buyers is probably pushed higher than it would otherwise be. It’s possible the true average age of first time buyers is a couple years younger than 33 years of age.
The goal of HUD is to get people in houses. To achieve this goal normal terms are changed to mean what the government wants. By expanding the definition of a first time home buyer, more people can qualify for FHA loans which allow less money down, a lower income, and a worse credit score. The government still thinks getting people in homes is a priority even after the housing bubble. We’re not saying that because the government didn’t learn it’s lesson, there will be another housing bubble. Private loan issuers learned their lesson and now require documentation and higher credit scores. There also isn’t wild speculation in the market as people have reservations about making the same mistake twice. However, there should still be a lesson learned about government intervention. When the government gets involved in an industry, it boosts demand like in housing in the 2000s and in college tuitions today. The government’s goal of encouraging everyone to go to college has the unintended consequence of increasing prices.
Rising Interest Rates Could Damage The Housing Market
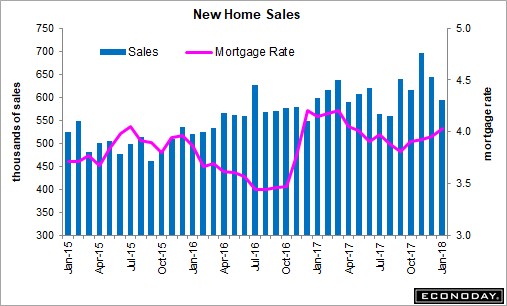
Even though the demographics imply there will be increased demand in the housing market, it doesn’t mean blue skies are ahead. As you can see from the chart below, mortgage rates are rising.
This chart is updated as of January. In February, the average 15 year mortgage interest rate is slightly above 3.8% and the 30 year average mortgage rate is 4.4%. This heightened mortgage rate might decrease sales because of the decrease in affordability. As you can see from the blue bars in the chart, the seasonally adjusted annualized new home sales were 593,000 in January. That missed the consensus for sales of 640,000 homes. The bright side of this report was that housing supply increased 2.4% from the previous month to 301,000. One of the problems with the housing market is there isn’t enough supply for housing in the right areas because of red tape. The largest drop in new homes sales were homes priced over $500,000. This is why the median price paid for new homes was down 4.1% month over month to $323,000. It was still up 2.5% year over year.
Housing Tenure Keeps Hitting Record Highs
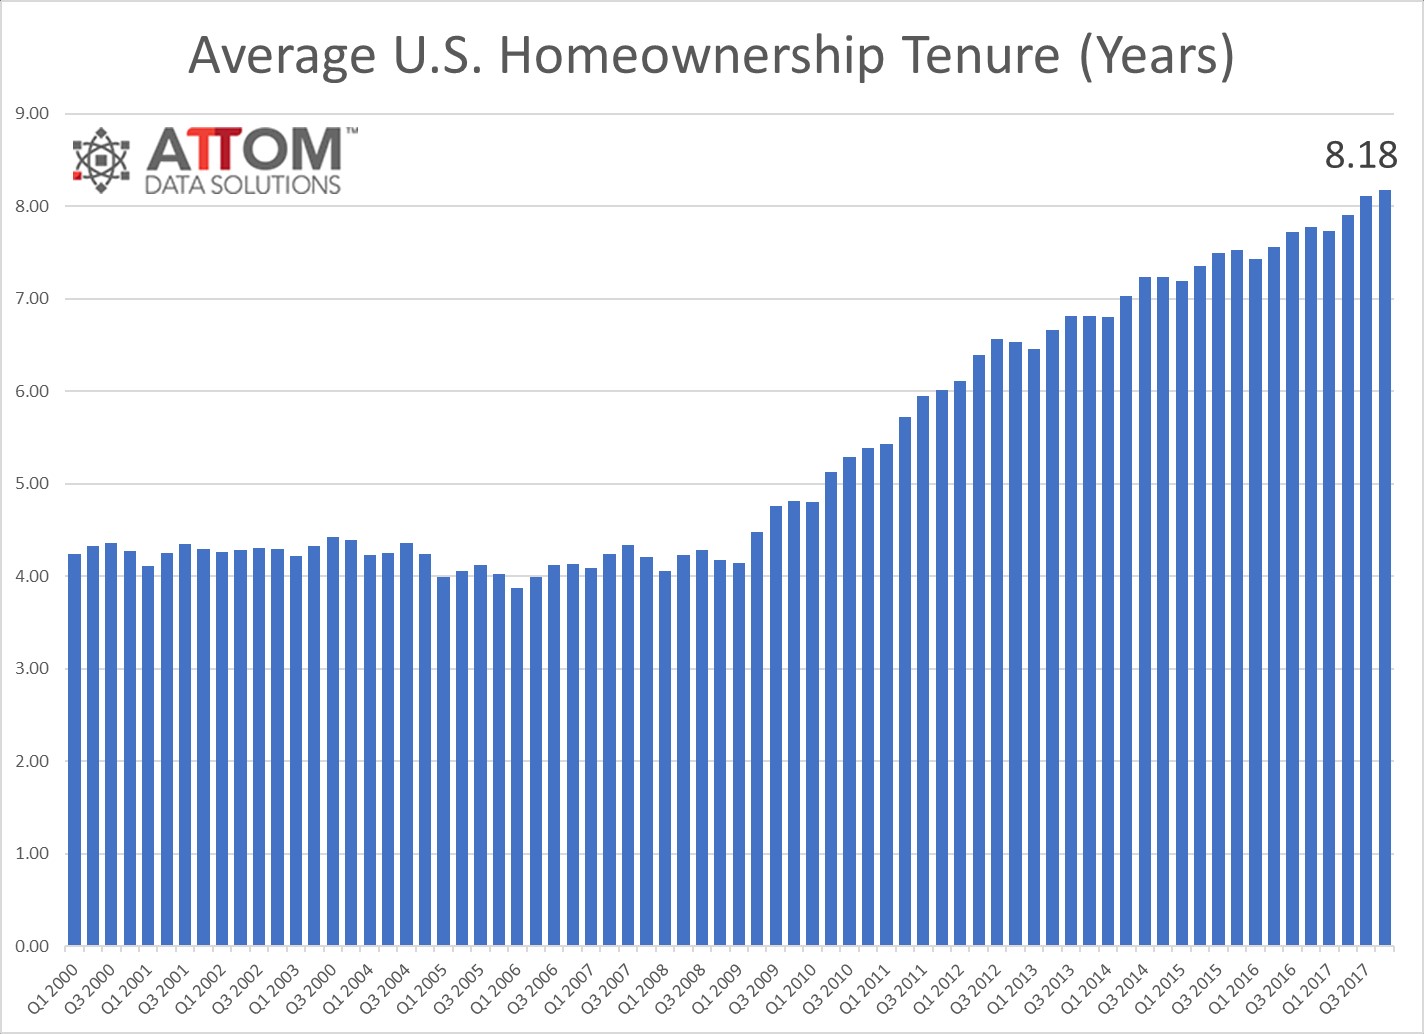
As we mentioned, the supply of housing is limited in places where people want to live. Government restrictions prevent building houses in areas that need them such as the populous parts of California. This is pushing up the average length home owners stay in their house. As you can see from the chart below, the average tenure of U.S. homeownership is 8.18 years which is an all-time high.
While homeowners are in the best sellers’ market in the past 10 years, there aren’t enough new homes to move into, so they stay in their existing home longer. The average realized price gain in Q4 was $54,000 which was up from $47,133 in Q4 2016. This is the best price gain since Q3 2007. This price gain is a 29.7% return on investment.
Home Sizes Are Declining
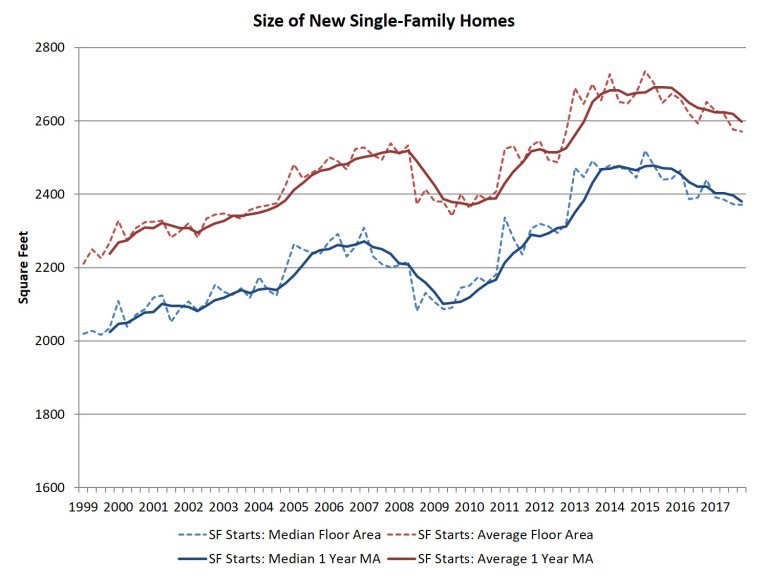
One of the reasons the price of new homes may have decreased in January, besides month to month volatility, is the size of new single homes is declining. As you can see from the chart below, the NAHB data shows the median single family home declined to 2,371 square feet and the average new single family home fell to 2,571 square feet.
The home builders initially focused on larger, more expensive homes after the housing recovery. However, now builders are focusing on the low end of the market. This is a great sign for those looking for more affordable housing. It is supported by the January report which showed supply increasing. Even with this recent decline, the 1 year moving average of the size of the new median home is up 13% from the recent trough.
Although this chart looks disconcerting because it is falling like it did during the last recession, this is good news because home builders moving from focusing on expensive to lower priced housing means there’s increased demand for more affordable housing, a signal that could suggest prices are getting too high. This is a sign that the housing cycle is moving to its maturation stage. There’s probably a few years before this cycle rolls over. When the cycle turns, it won’t get as bad as the last cycle which culminated into the housing crisis, because the loans given out were to more worthy borrowers than previously. While some areas of real estate are experiencing bubble like valuations, stating that something that is overvalued is in a bubble is an incorrect perspective. Overall, the housing market in the US is becoming overvalued, but is not in a bubble like in 2007.
Conclusion
Unfortunately, even though the government wants to get people into homes, it is hurting housing affordability because of red tape preventing new construction. The increase in building material costs because of the commodity price increases in 2018 are also hurting the home builders. The housing market is healthy and as long as the labor market remains strong and experiences some increased wage growth, which has thus far not been the case, the housing market will stay healthy, experiencing normal cyclical ups and downs, but not the types of shocks experienced in 2008. Based on the business cycle timing indicators we use, there should be a couple more years of strength.
Have comments? Join the conversation on Twitter.
Disclaimer: The content on this site is for general informational and entertainment purposes only and should not be construed as financial advice. You agree that any decision you make will be based upon an independent investigation by a certified professional. Please read full disclaimer and privacy policy before reading any of our content.


