UPFINA's Mission: The pursuit of truth in finance and economics to form an unbiased view of current events in order to understand human action, its causes and effects. Read about us and our mission here.
Reading Time: 5 minutes
Q2 GDP growth was impressive. In fact, the report was so good that the main criticism it is receiving is whether the economy can maintain this pace. The ECRI leading index doesn’t anticipate for this pace to be maintained because it is forecasting a slowdown. Obviously, that’s only one indicator, so it’s far from a foregone conclusion that there will be any slowdown at all. Specifically, Q2 quarter over quarter seasonally adjusted real GDP growth was 4.1%. As you can see from the table below, there was 4% real consumption growth which represents 69.4% of GDP.
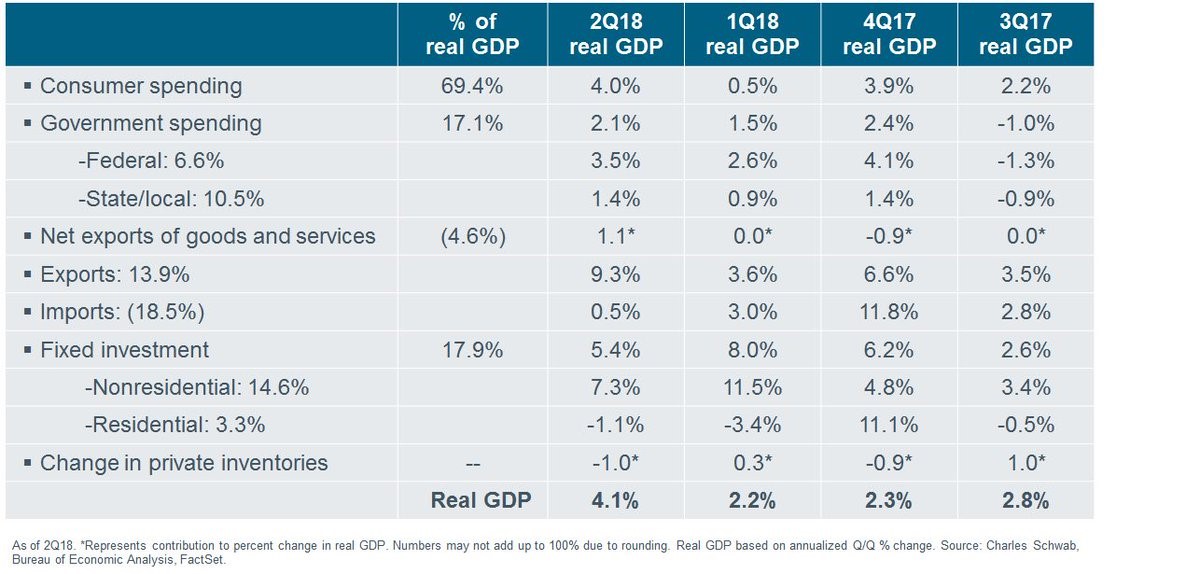
Source: Charles Schwab
The economy needs the consumer to succeed and it did this quarter. Consumption growth accelerated sharply from Q1 growth, which was only 0.5%. We will be talking about the health of the consumer in greater detail later in this article.
Growth Could’ve Been 3.6% Or 5.1%
The numbers can be manipulated positively or negatively, depending on how you see one time events. This is always the case because there’s always a different temporary factor affecting the economy. Since we see two counteracting forces, we still stick with the narrative that this was a great quarter. On the negative side, the growth in exports was driven by soybean exports which were up 26% because producers tried to transact ahead of the tariffs. There was an 80% annualized increase in food, feed, and beverage exports. Without that increase, exports would have been up 5.3% which means GDP growth would have been 3.6%.
On the other side, inventories were down $27.9 billion, which hurt GDP growth by 1 point. Without this change in inventories, GDP growth would have been 5.1%. If inventories were up, growth would have been even higher. With continued growth, inventory investment will increase in future quarters to make up for the deficit. Inventory hurting GDP growth is an early cycle phenomenon. This happens when demand increases and firms don’t have necessary supply. The chart below shows the ratio of inventories to final sales of goods and structures.
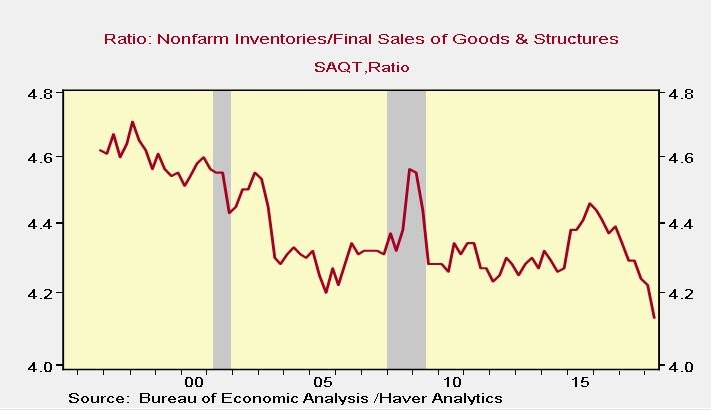
Source: Haver Analytics
There has been a secular decline due to offshoring, global trade, containerization, tax avoidance, and trade finance. Oil inventories partially caused the recent decline. If firms decided to increase the exports of existing inventories to beat the tariffs, there was no effect on GDP because exports help GDP and the decline in inventories hurt GDP.
Savings Rate Increases Due To Massive Revisions
The historical savings rate was altered in the latest GDP revision which occurs every 5 years. We have used this savings data in our previous articles. We had no idea the numbers would be altered so severely. As we will detail further, the alterations make sense; it’s just a big change to many years of data that is surprising. The charts below are great because they show the historical change in the savings rate before and after the revision and they demonstrate the difference between the two points.
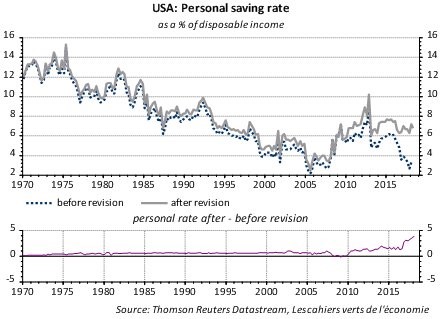
Source: Thompson Reuters
The biggest increases were in the past few years, which means the savings rate isn’t getting close to being historically low like we thought. Investors who are bearish on markets utilized this data to support their point that the consumer was did not have any savings left. It didn’t compute with the point we have made in previous articles, which is that the consumer has deleveraged in this cycle. Now that we know that the savings rate isn’t that low, everything makes sense. The consumer’s balance sheet is in great shape. This doesn’t tell us when the next recession will occur; it tells us the consumer is in better financial shape to handle the next downturn which implies the recession won’t be as bad as 2008 since consumer spending accounts for the majority of GDP growth.
Source: Twitter @MikeDonnellyJr
Specifically, the savings rate went up because the income numbers were increased. The chart above shows the historical changes to the savings rate. The revisions are often volatile. Proprietors’ income was revised higher by $401.9 billion in 2017; that was a 2.4% increase. The income was up $196.4 billion in 2016 and $166.7 billion in 2015. The 2017 savings rate went from 3.4% to 6.7% and the 2016 savings rate went from 4.9% to 6.7%. This is a significant difference which shows us the consumer isn’t in dire financial ruin like some proposed before this revision.
The chart below is great evidence that the consumer is in good shape.
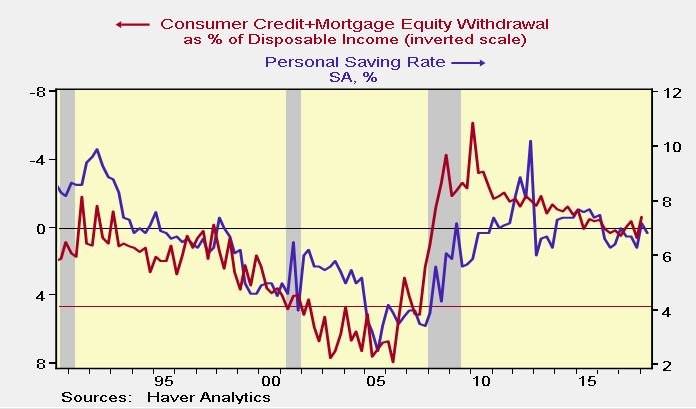
Source: Haver Analytics
Consumer credit plus the net equity extraction from mortgages as a percentage of disposable income (inverted scale) is showing that the consumer has deleveraged most of this cycle. The rate of increase in leverage is nowhere close the level seen in the prior cycle. This is elevating the savings rate.
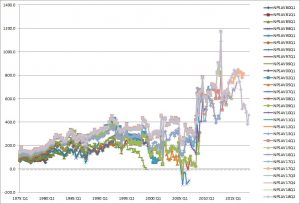
Discretionary Spending Vs. S&P 500
As we mentioned, consumer spending drives changes in GDP. As you can see from the chart created by J. Brett Freeze, discretionary spending and the S&P 500 have an R^2 of 0.9581. This means their data sets fit each other almost perfectly. Discretionary spending drives GDP growth and correlates with stock market performance.
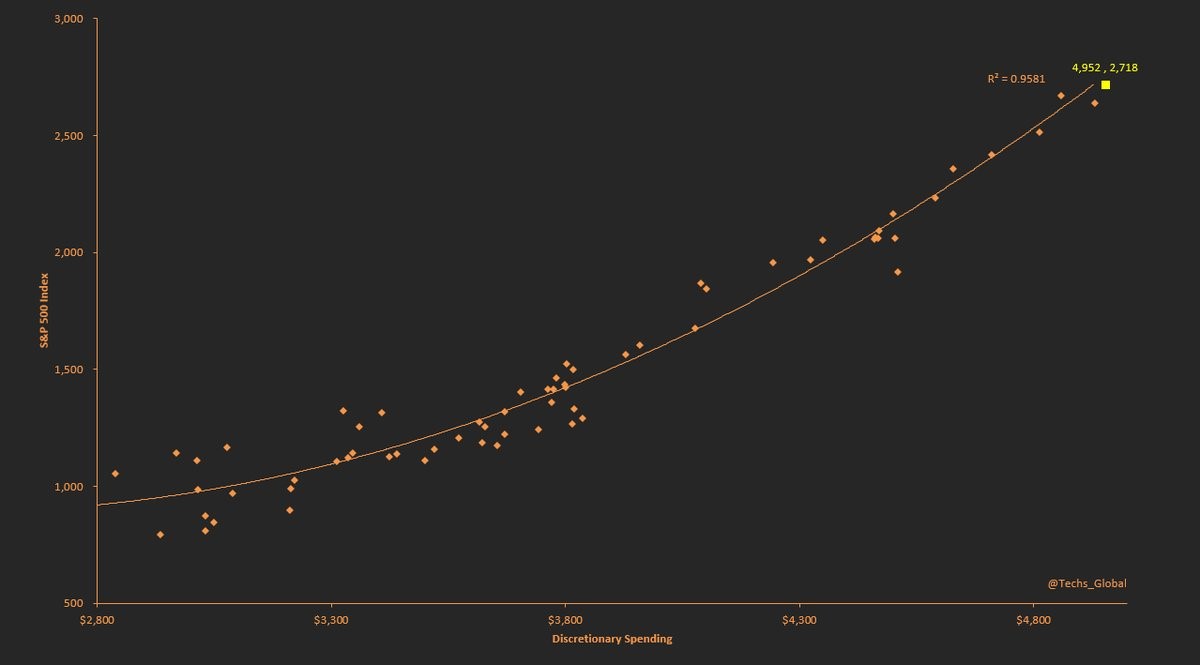
Source: Twitter @Techs_Global
Increased Inflation
The price index in the GDP report was 3% which beat estimates for 2.2% and was above last quarter’s index of 2%. The core reading was 2.7% which was 3 tenths higher than last quarter. This means price pressures are above expectations. The economy could be starting to overheat. The Tuesday PCE report will give us an update on June’s inflation reading. The core PCE price index is the Fed’s favorite measurement of inflation. The regional Fed manufacturing price indexes are all signaling that inflation is accelerating, with some hitting record highs. The latest Fed funds futures are pricing in a 68.6% chance of 2 more hikes this year as the Fed moves closer to having contractionary policy which slows lending growth and pushes the economy into a recession.
Conclusion
Don’t bother with the politically motivated stances on GDP growth. The economy is doing well according to the objective evidence. Increased inflation can bring an end to growth in the next few quarters, especially if the Fed raises rates quickly. The most interesting part of this report was the wholesale change in the savings rate data which shows the consumer is in better shape than we thought. We already knew the consumer was doing well because leverage has declined in this expansion. Now we know the savings rate isn’t near a record low, which is a positive sign.
Have comments? Join the conversation on Twitter.
Disclaimer: The content on this site is for general informational and entertainment purposes only and should not be construed as financial advice. You agree that any decision you make will be based upon an independent investigation by a certified professional. Please read full disclaimer and privacy policy before reading any of our content.


