UPFINA's Mission: The pursuit of truth in finance and economics to form an unbiased view of current events in order to understand human action, its causes and effects. Read about us and our mission here.
Reading Time: 4 minutes
The labor market is one of the most important factors which drives the economy because about two thirds of the economy is driven by consumption. Consumers can’t buy goods and services if they aren’t getting a raise or they don’t have a job at all. The labor market is tough to analyze currently by looking at conventional metrics. Face value analysis usually doesn’t get you far and this situation is no different. The face value stats are the unemployment rate is 4.5%, which is near where it has fallen to in previous cycles before the stress cycle starts, the number of jobless claims compared to the size of the labor market is showing the tightest labor market ever, and hourly earnings growth has been stagnant.
The face value stats aren’t making sense because hourly earnings should grow at an accelerated pace if the jobless claims and unemployment rate are low. This is because of the law of supply and demand as less workers looking for a job means higher pay for the workers. This lowers profit margins for corporations as labor costs rise. This factor I’m referring to is known as slack in the labor market. The slack in the labor market is the amount of workers who are available to work, but haven’t found a job yet. Usually the slack in the labor market isn’t a mystery. You can simply look at the unemployment rate to see how much slack there is. When the unemployment rate is low, there’s not much slack and when the unemployment rate is high, there’s a lot of slack.
Recessions are a terrible time for workers as there aren’t many jobs and the pay is low. Peaks in the labor market have the exact reverse scenario as jobs are plentiful and pay is high. This nirvana is possible because businesses usually overproduce at the end of a business cycle. At this point in the cycle where optimism is plentiful, the belief is that the economy will continue growing. Excess production can cause excess supply that is not met by demand, thus forcing companies to lower price and production, thus hurting growth.
The mystery can be seen in the chart below as some economists claim the labor market is at full employment, yet the nonsupervisory & production hourly earnings growth has been weak.
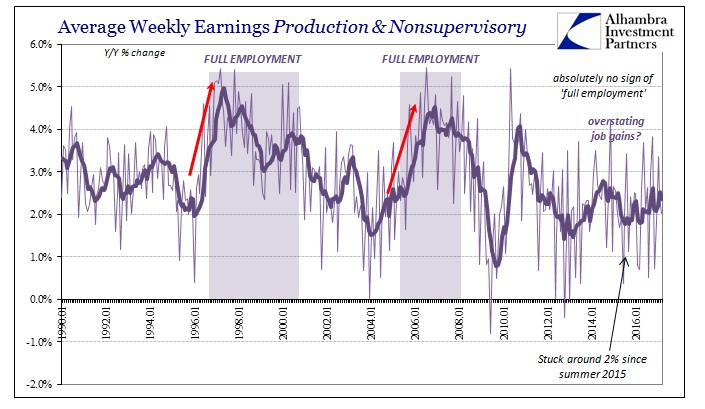
Top management may be getting more stock options than ever as stock prices soar, but the average worker is getting crushed as the nirvana of pay increases isn’t here.
You may look at the growth in wages and think saying the workers are ‘getting killed’ is an over-exaggeration. It is not an extreme statement because wages aren’t increasing at the rate primary residence expenses are rising. Every pay raise is a pay cut in disguise. Low interest rates have pushed up bonds, stocks and real estate. Real estate price increases cause rents to be hiked. If you buy a building for a higher price than five years prior, you must raise the cost of rent to make up for the added cost. This is why cost of rent increases alongside real estate valuation, as does insurance and taxes.
The orange line in the chart below shows rent costs and the blue line is earnings growth.

Rent costs have been rising faster than earnings since quantitative easing began in 2008. This also happened in the late 1970s and mid-1980s.
There is clearly more unemployed individuals in the labor market than is being portrayed by the mainstream labor statistics. This is not surprising when you look at the labor force participation rate. As we have detailed earlier, the unemployment rate is not the most accurate measure for understanding the labor force. As such, the labor force participation rate happens to be a much more reliable measure. If the labor force participation rate is high, that means unemployment should be low. When the participation rate is low, unemployment rate should be high.
As you can see in the chart, the labor force participation rate used to be 67% in 2000. The current labor for participation rate is 63%.
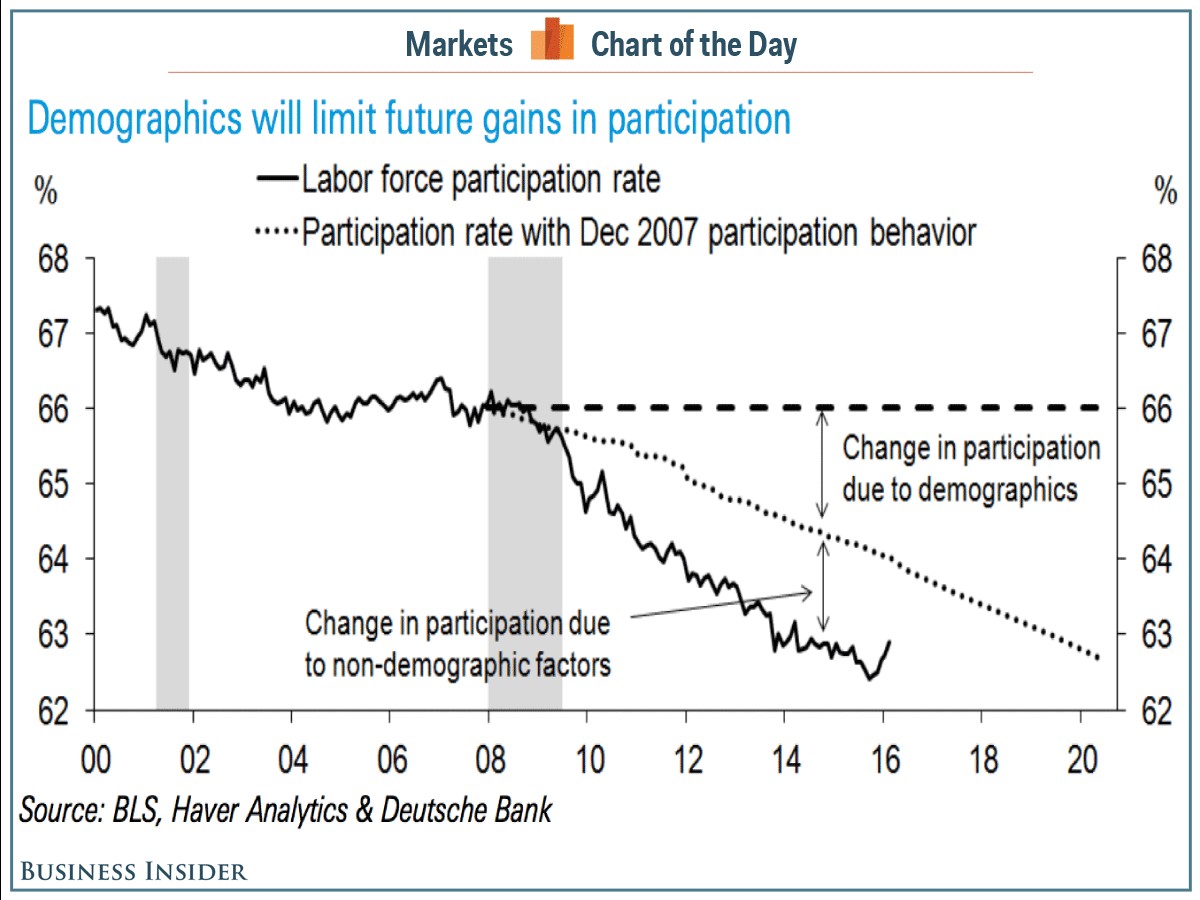
The baby boom generation retiring has something to do with the change. The dotted line shows the demographic causes of the declining labor force participation rate. As you can see, the remnants of the recession have suppressed the labor force participation rate by about 1%. That’s the extra unemployed individuals not showed in the other statistics.
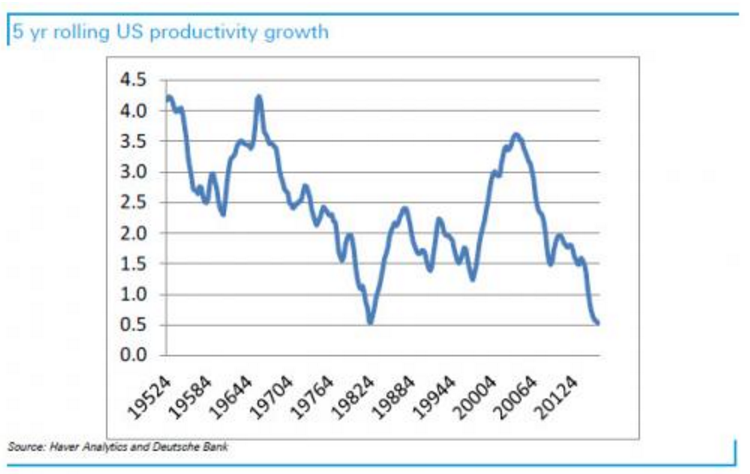
Despite the growth in college educated individuals in the United States, as we have detailed earlier, productivity continues to fall.
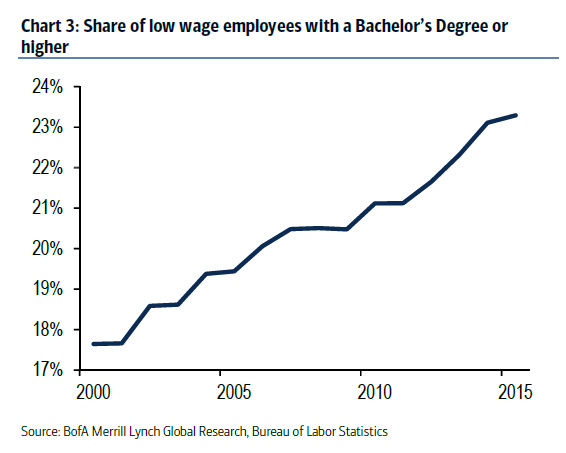
While the share of low income earners who also have a Bachelors degree continues to rise:
Conclusion
Because earnings are not rising alongside the cost of living, this is indicating that in fact the unemployment rate of 4.5% is inaccurate. Had there been in reality such a small number of unemployed, there would be increases in wages. However, because this is not happening, this indicates that the economic problems are structural in nature and have not been addressed with the Fed’s quantitative easing program of the past 8 years. Additionally, companies continue to hire more part-time workers than full-time workers since there are a number of new regulations and tax increases that were introduced as part of the Affordable Care Act that increase the employer costs of having full-time employees. Unless structural changes are made to the economy to boost growth, there is no impending catalysts that would magically increase wages or the labor force participation rate.
Have comments? Join the conversation on Twitter.
Disclaimer: The content on this site is for general informational and entertainment purposes only and should not be construed as financial advice. You agree that any decision you make will be based upon an independent investigation by a certified professional. Please read full disclaimer and privacy policy before reading any of our content.


