UPFINA's Mission: The pursuit of truth in finance and economics to form an unbiased view of current events in order to understand human action, its causes and effects. Read about us and our mission here.
Reading Time: 6 minutes
In this article, we’ll discuss the unusual timing of the fiscal stimulus and how it could affect markets. Keep in mind, this isn’t a partisan article. Our purpose is to review objectively both the good and the bad. Most administrations want to cut taxes and increase spending to boost the economy. Usually the election cycles are coordinated with the business cycle since the business cycle is manipulated by fiscal and monetary policy.
While regulation and tax cuts help the economy, they were combined with extra spending, thus deteriorating the US balance sheet, which carries with it long-term consequences that may not be evident today. Something which many economists and pundits overlook is that the budget is supposed to look its best at the end of a prolonged economic expansion, towards the end of the business cycle because corporations have high profits and most people have a job. These factors improve tax revenues and push down spending on services such as food stamps and unemployment insurance. The worry is this poor timing means there won’t be any solutions, otherwise referred to as “ammo” left to stimulate the economy once the business cycle ends and a recession begins. As we have mentioned previously, recessions are necessary because they fix nonperforming uneconomic aspects and allow the economy to grow stronger and healthier in the long-run.
What’s particularly troublesome this time during the late cycle expansion is the already high deficits imply devastating deficits during and after an inevitable recession. We can argue whether a recession is likely to occur in the next two years, as we have indicated previously, or sometime around 2023 or later as the market is pricing it, however the reality is that the US balance sheet is slated to worsen, not improve. There are some optimistic investors who believe deficits don’t matter because they haven’t caused a crisis yet. However, past is not prologue, and this doesn’t imply that larger deficits of the future won’t cause a tipping point which could lead to a significant currency depreciation over-time. However, with that said, if you are expecting Zimbabwe or Venezuela style inflation, you are mistaken, at least given the current political and economic trends.
Budget Deficits & Unemployment Don’t Match
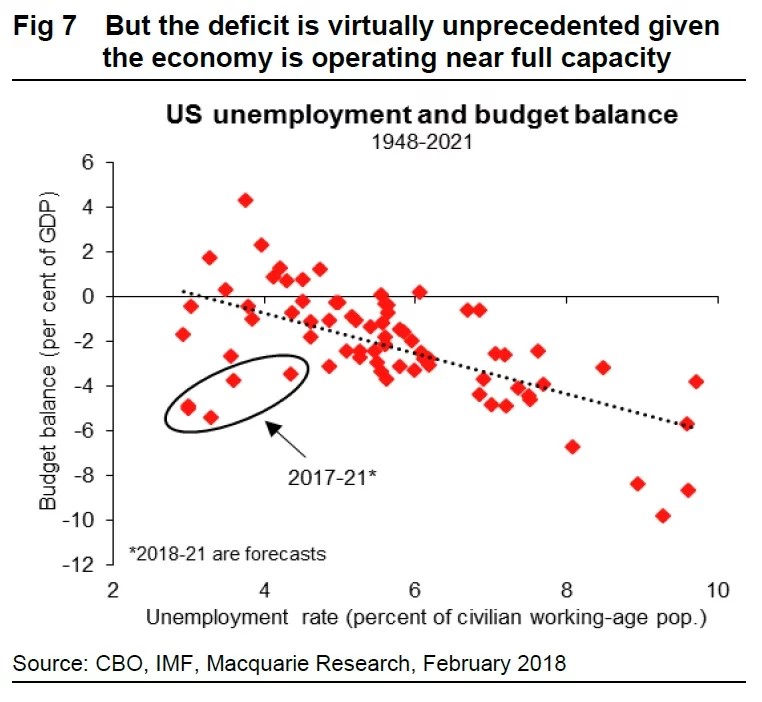
To illustrate the unusual timing of the fiscal stimulus, the chart below compares the budget balance to the unemployment rate.
While the government spending and revenues generated are projections which could be wrong, a $400 billion two year spending deal combined with tax cuts isn’t a step in the right direction since the aging population is already causing more money to be eaten up by heath care spending and entitlements. As you can see from the projections, the deficits are high for the unemployment rate. It would have made sense to be consistent with what Republicans used to argue in favor of which was cutting spending and taxes. That would have had a more neutral effect on the economy at a time where it doesn’t need a stimulus. To clarify, we are not complaining about the benefits of the tax cuts, though only to state that it comes with long-term risks that the taxpayer will be liable for.
Higher Debt Costs Coming?
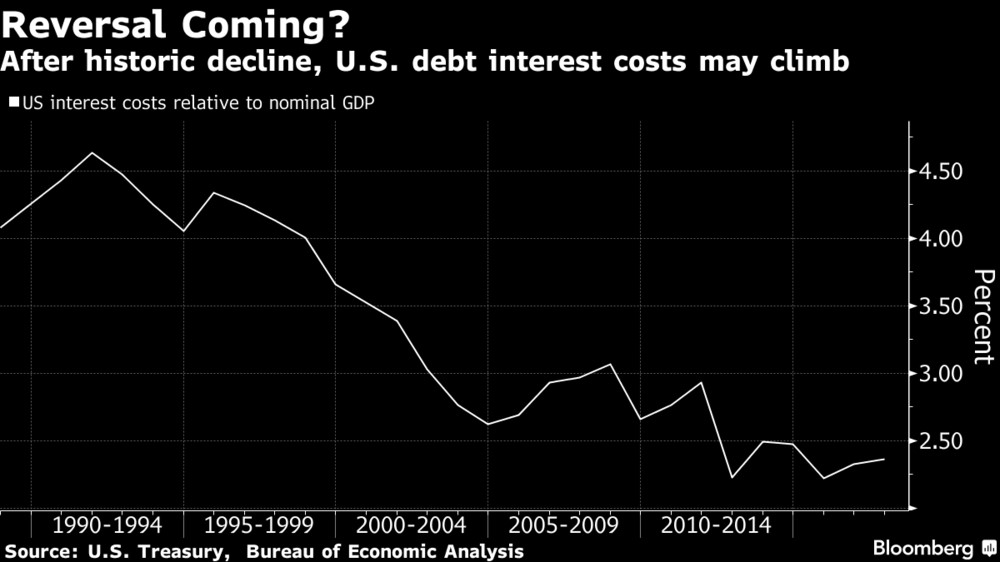
The projection for heightened deficits could be too optimistic, not only because it expects the economy to stay in an expansion, but also because it expects borrowing costs to stay low. As you can see from the chart below, the U.S. interest costs compared to nominal GDP are near the record low. Rising rates, would cause the deficit to explode. According to the Congressional Budget Office, each one point increase in interest rates increases the deficit by $1.6 trillion over the next 10 years.
The worry about the stimulus is that it boosts growth which translates into inflation which brings up interest rates. The low unemployment rate implies there’s not enough slack in the labor market for hiring growth to occur without spiking inflation. The worst case scenario would be heightened inflation and deficits. Another issue with the $400 billion plan is government spending could crowd out private investment.
Fiscal Policy Effect On The Dollar
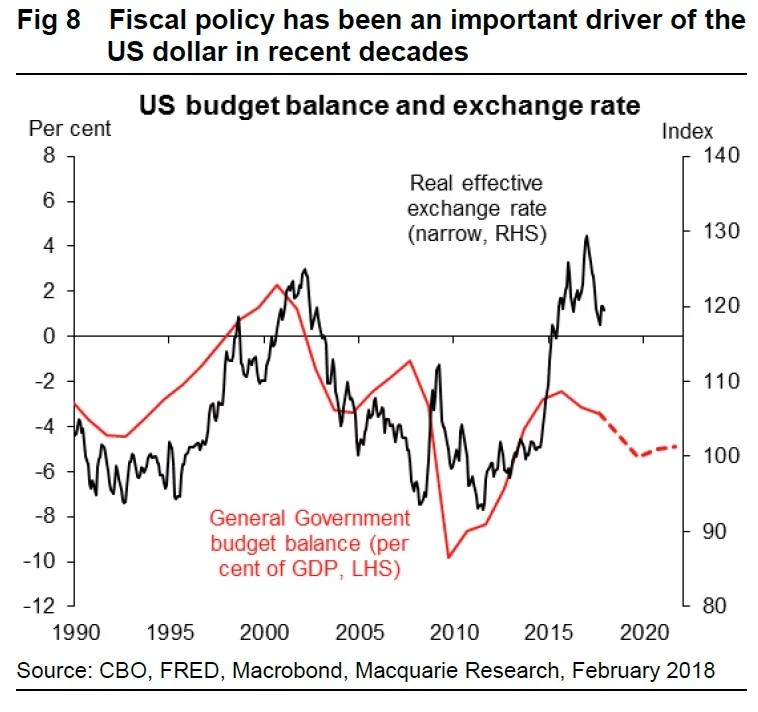
There is potential for the dollar to be impacted by the growing deficit. The chart below shows the relationship between the budget balance and the dollar index. It shows the dollar index should be coming down because the deficit is increasing.
However, correlation doesn’t always equal causation. There are other factors which also affect the dollar. The dollar is also a currency investors flock to when they want safety. This occurred when the dollar rallied in value in 2008. Since deficits were spiking, the correlation wrongly expected the dollar to fall. Another aspect which affects currencies is monetary policy. The ECB’s negative interest rates and QE program may have caused the euro to weaken versus the dollar, causing the dollar index to strengthen. Furthermore, the weak global economy in 2016 could have also caused investors to buy the dollar. Finally, the strong emerging market economies and the ECB tapering plan could be what has been causing the dollar to weaken in the past year.
In conclusion, the chart above is relevant because there could be a dollar crisis created by future excessive deficits. The situation which could cause a dollar crisis is a recession where there are also high rates. There are many other factors which impact the dollar, so it’s wrong to look at the budget balance as being the only driver of the dollar.
Counterpoint: There’s Still Slack In The Labor Market
We always like to provide as much data as possible in our articles to constantly question each narrative. If you’re not questioning what you know to be true, you could be vulnerable to missing a thesis which can prove you wrong. Just like how successful tech companies disrupt their own businesses before competitors can, you need to disrupt your own thinking to improve your analysis.
The thesis that the labor market is too tight to absorb the new demand coming from the stimulus might be incorrect. The chart on the left shows wage growth and the unemployment rate to illustrate this point.
Wage growth is lower than the best fit line suggests it should be. There could be modest acceleration in wage growth before there is a major problem with inflation. The chart on the right shows the employment to population ratio compared with wage growth. It fits on the best fit line showing the labor market is about halfway through the cycle. This isn’t the truth though because demographics impact the employment to population ratio.
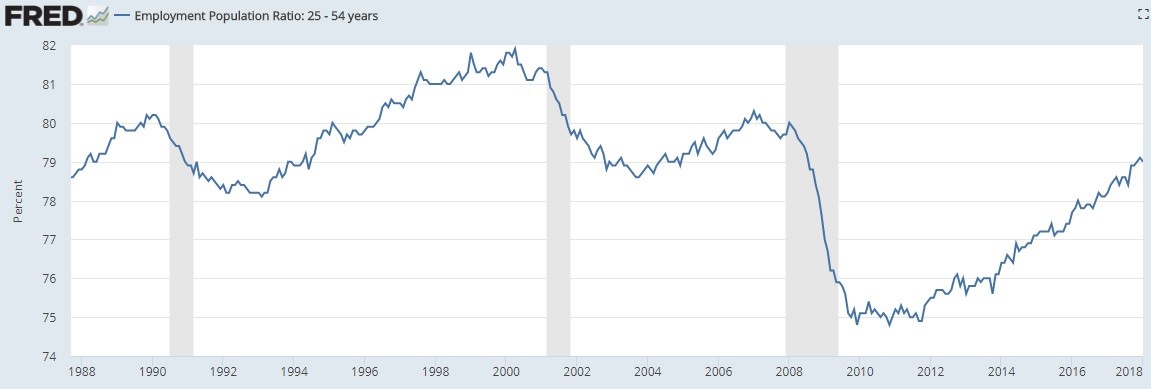
The chart below adjusts for demographic changes by looking at the employment population ratio for 25-54 year old Americans.
As you can see, the ratio is at 79%. The average peak in the past 3 cycles is 80.8% meaning the ratio has 1.8% of slack left before the labor market is at full employment. While that doesn’t seem like a lot, it took from September 2016 to November 2017 to move up from 78% to 79%. It could take about 2 years to go from 79% to 80.8%. This means the economy is far enough from full employment for the stimulus to cause growth without a large spike in inflation.
Conclusion
We leave it up to the reader to decide if the stimulus was ill-timed. On the one hand, the expansion is almost the 2nd longest since 1854 and the unemployment rate and jobless claims are very low. On the other hand, wage growth is below previous cycle peaks and the employment to population ratio is 1.8% below the average peak in the prior three cycles.
Have comments? Join the conversation on Twitter.
Disclaimer: The content on this site is for general informational and entertainment purposes only and should not be construed as financial advice. You agree that any decision you make will be based upon an independent investigation by a certified professional. Please read full disclaimer and privacy policy before reading any of our content.


