UPFINA's Mission: The pursuit of truth in finance and economics to form an unbiased view of current events in order to understand human action, its causes and effects. Read about us and our mission here.
Reading Time: 6 minutes
Our previous article in this series reviewed the bullish case for equities. As you may imagine, it received a lot of criticism. The purpose of our content is to review both side of the debate. If you ignore arguments that may not agree with your thesis, there is a high risk that your investment returns will suffer. The key is being open minded about the possibility of being wrong. No one was a crystal ball. Yes, markets are overvalued. Yes, central banks have created an environment that is conducive for risk assets. No, it will not last forever. But no one knows if today is the last day of the bull market, or a year from now. Timing is the critical aspect that few successfully execute on because it is so darn difficult.
One of the most heated discussions in finance is about valuations. Valuations are always important, but the discussion has become more prevalent lately because the CAPE or Shiller PE is showing stocks are expensive which implies future returns will be low. The Shiller PE is the price divided by a 10 year moving average of earnings adjusted for inflation. Since stocks go up about 70% of the time, it would be a big deal if real returns were close to zero over the next ten years. Because of the euphoria in the market, the concept of this is foreign to most traders, but it has happened before and can happen again.
The chart below shows the 10 year Shiller PE is at 34.134 making it the 2nd highest peak since 1881.
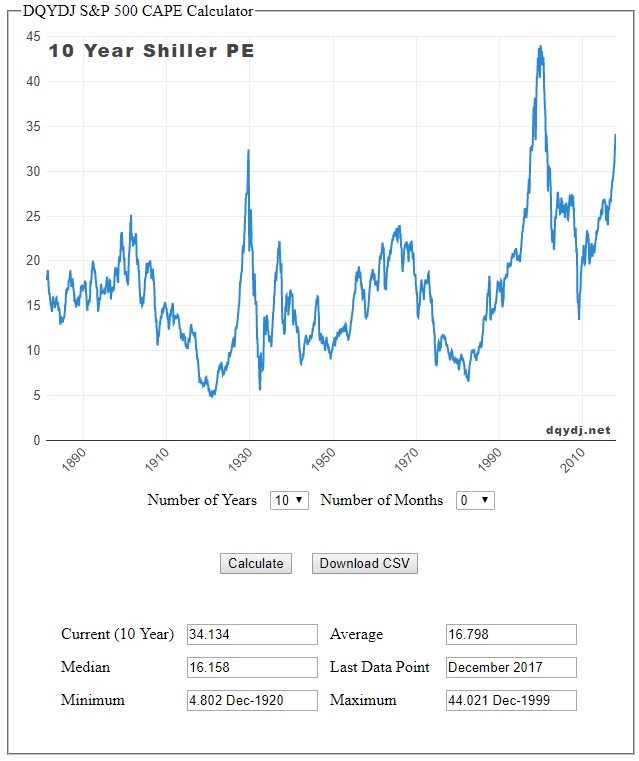
Shiller PE Is The 2nd Highest Ever
It’s over double the median which is 16.158. At face value, the Shiller PE implies low future returns, but finance professionals never leave anything at face value. We’ll look at the some of the best arguments in favor of listening to the Shiller PE in this article. Stock valuations are an opened ended concept as many good points are made on both sides. There is never going to be a concrete answer which tells you where stocks will go. It’s possible to predict returns based on what’s likely to happen, but you’ll never know for sure what will occur. The economy is a complex system with many constantly changing variables.
Shiller PE Works Well In The Long Term
The most obvious place to start this discussion is to show proof that the Shiller PE predicts returns. As you can see from the 4 panels below, as the length of time increases, the predictability of returns based on CAPE grows.
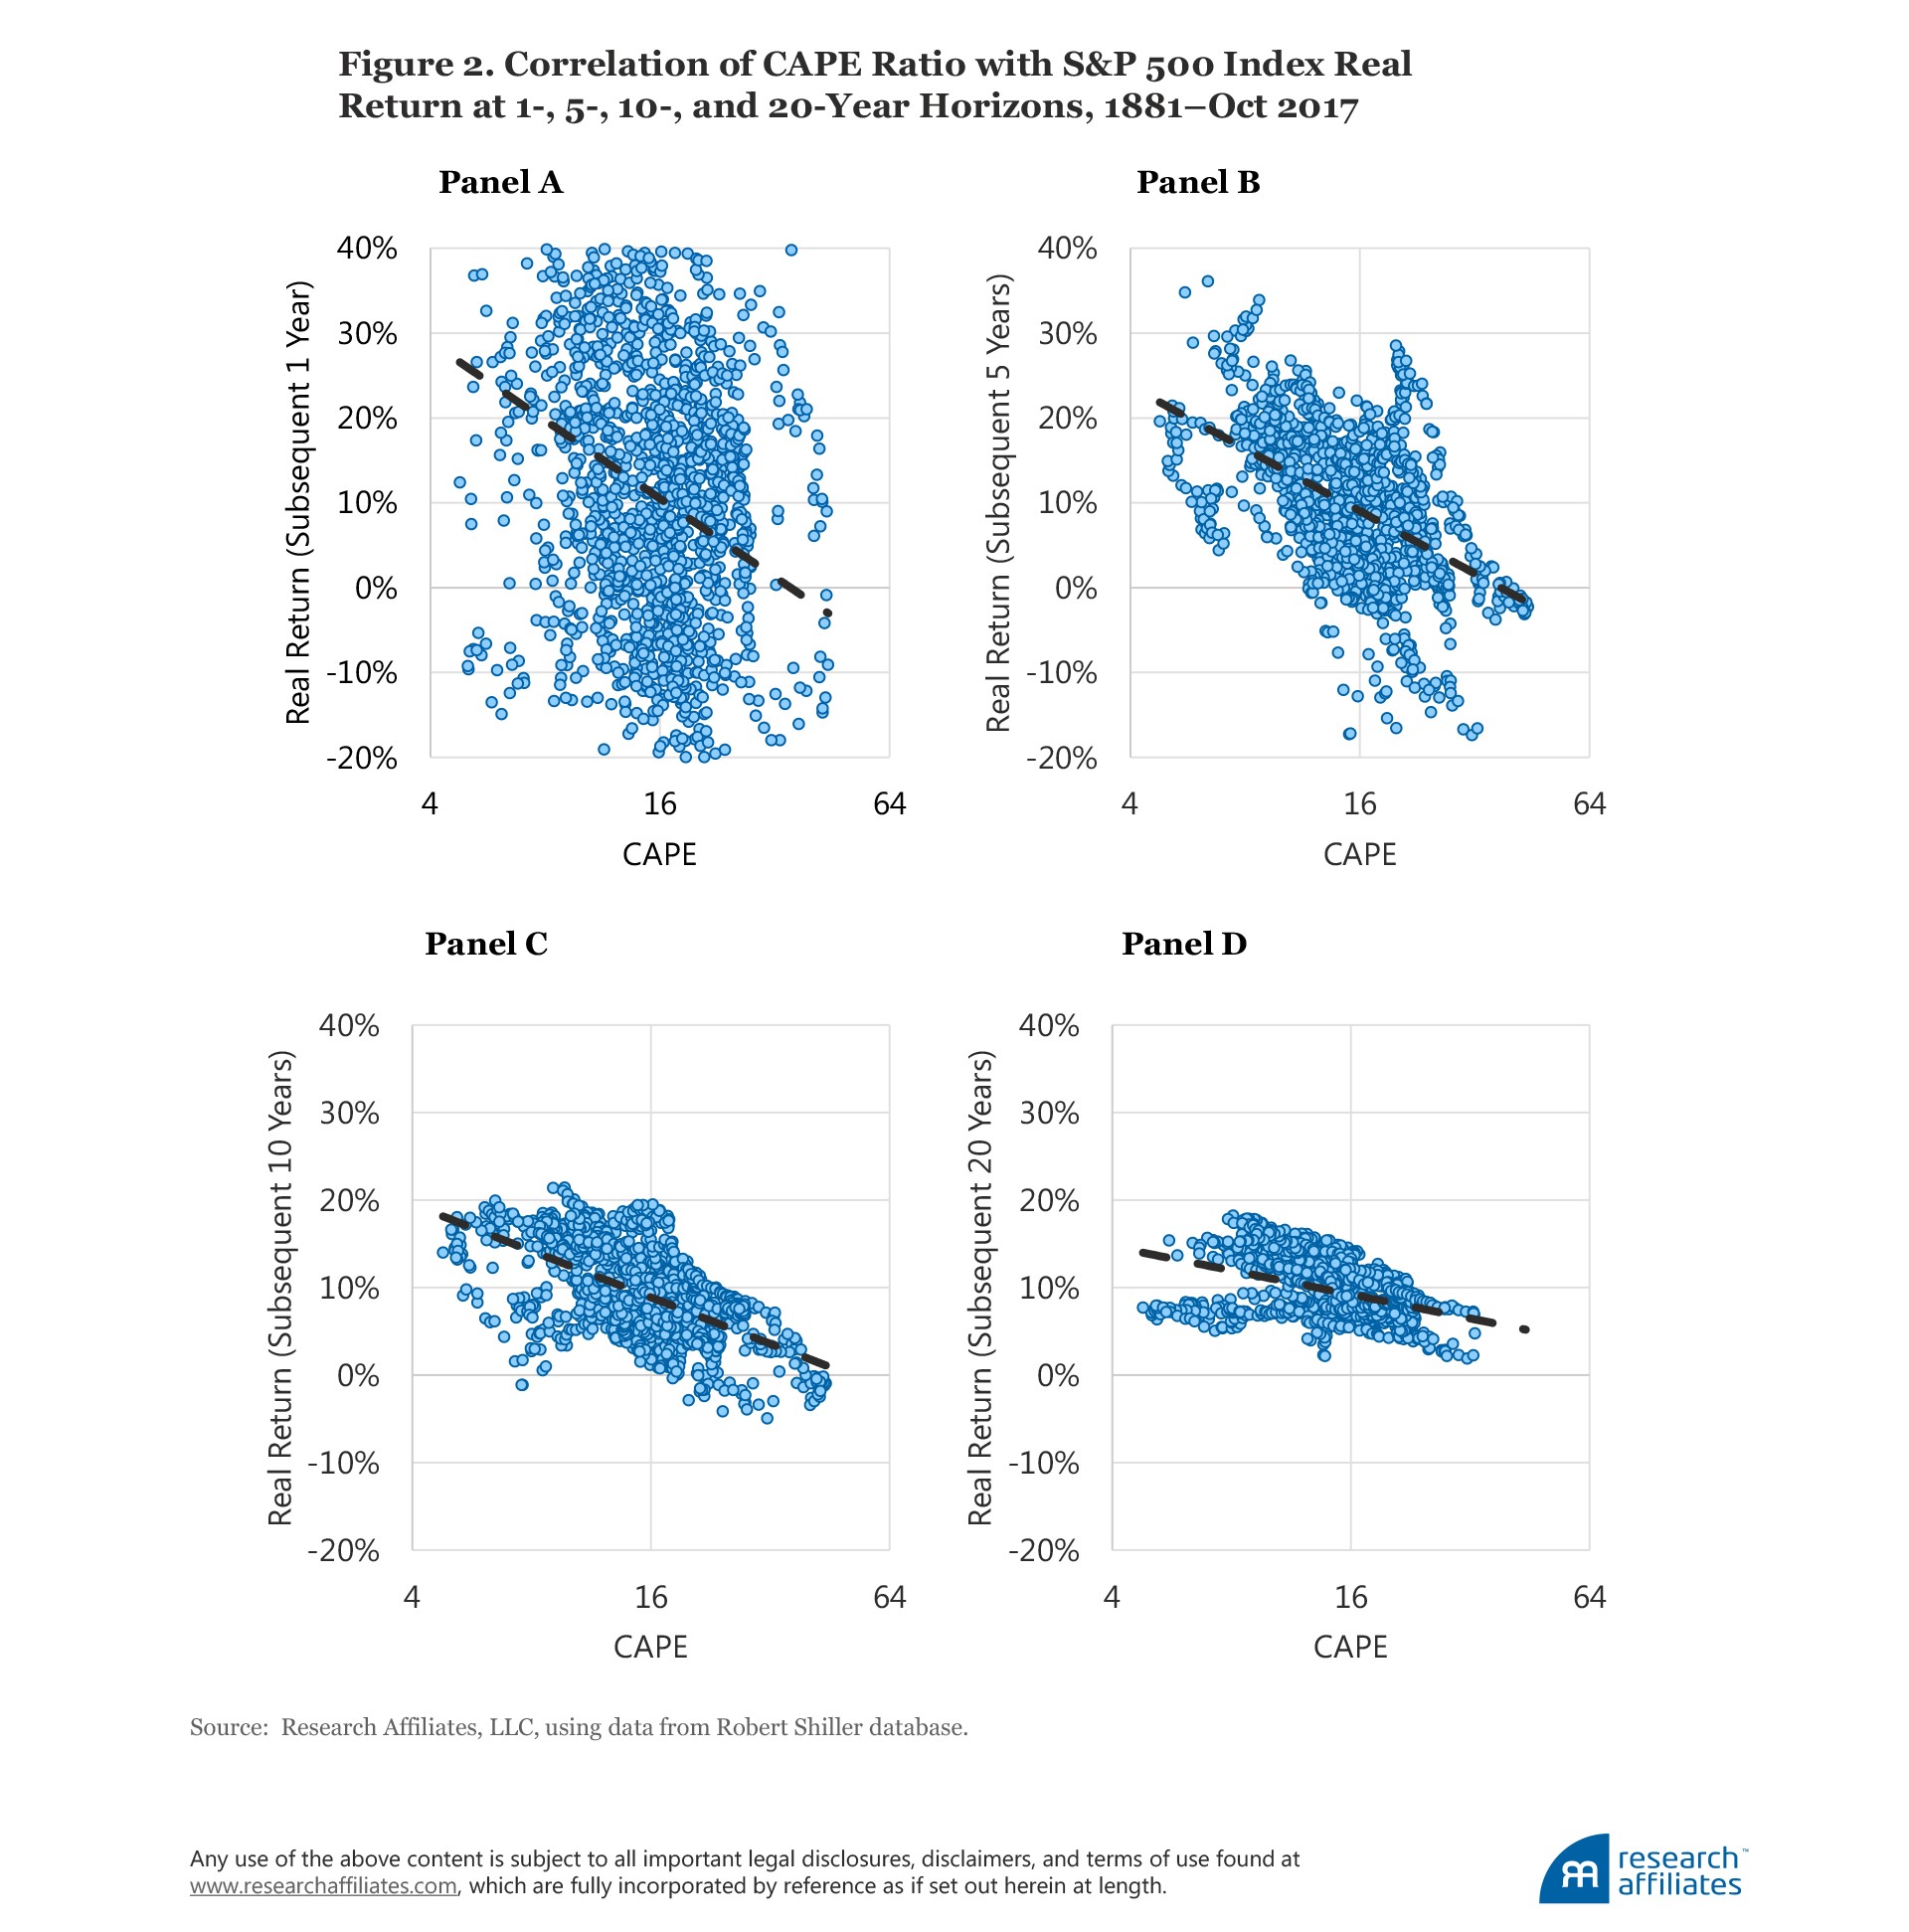
Shiller PE Predicts Long Term Returns
The higher the CAPE, the lower 10 and 20 year annualized returns. If returns are high in the next 10 years, it would be unusual given the high CAPE. This is the 3rd longest expansion. In the midst of achieving low potential returns, the chance of a volatility event increases as the business cycle comes close to ending. On our way to achieving low returns, there can be a crash and a recovery. On the point that the economy is in a long expansion, some are saying in the next year the low earnings in 2008 won’t be included in the 10 year Shiller PE, which means the PE is temporarily high. This is a bad point because the point of having a cyclically adjusted PE is to include recessions and expansions. Most of the history of the Shiller PE includes a recession or two. The longest expansion was 10 years. That one period in the 1990s didn’t have a recession.
Falling Tax Rates Aren’t A Reason To Think Shiller PE Won’t Work This Time
Besides the fact that the 2008 financial crisis won’t be included in the 10 year CAPE next year, there are other arguments which claim ‘this time is different.’ For example, some bullish investors say the lowered statutory tax rate from 35% to 21% means returns will be high even though the CAPE is high. The initial counterpoint to this claim is that the effective tax rate has been falling for years. As you can see from the chart, corporate tax rates fell from 1960-1980 and then from 1990 to the present.

Corporate Cash Tax Rate Has Been Falling For Years
Taxes paid by most firms will fall, but this has been a trend for a while. One can make the argument that we’re near the end of this long term downtrend in tax rates because of the increase in wealth inequality. We’re not endorsing the idea that raising taxes on corporations will solve inequality, but if enough politicians and voters do, then taxes will be raised. The Democrat Party, which is the party most likely to raise the corporate tax rate, is winning in the latest polls. Polls aren’t perfectly accurate, but it’s fair to say the Democrats have upward momentum.
The chart below cements the 2nd chart in this post. It shows how consistently 5 year real annualized returns in the S&P 500 have acted in tune with the 5 year CAPE. The CAPE scale is reversed because as stocks get more expensive, returns decrease. With the 5 year CAPE at 29.905, this chart implies negative 5 year real returns.
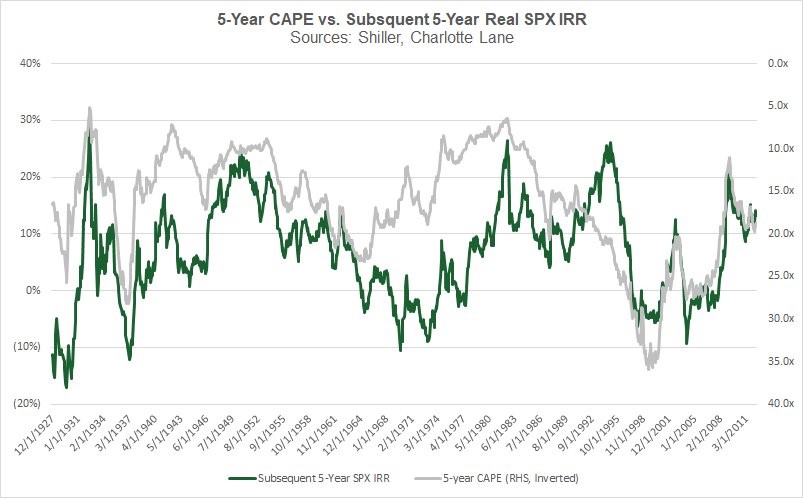
5 Year CAPE Predicts Returns Even In A Changing Tax Rate Climate
Consider Emerging Markets Since U.S. Stocks Are Expensive
Now let’s look at the best way to act on this thesis. As you can see from the chart, the US is in the expensive category and emerging markets are in the cheap category. This is a starter chart for research. It can be wrong. For example, the political risk in Russia makes it risky. The Italian banks have too much debt and the southern part of the country has structural economic issues, making it tough to invest in the country even though it’s listed as cheap.
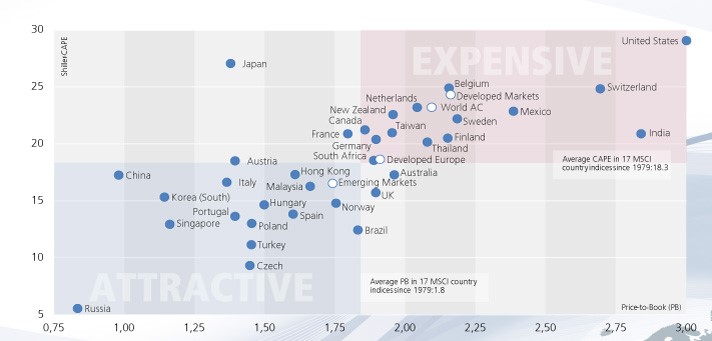
Diagram Which Shows How Expensive Various Equity Markets Are
The central and eastern European countries like Turkey, Hungary, and Poland are expected to see a deceleration in growth. That being said, on a historical basis, the ratio of emerging markets to American equities shows emerging markets have been underperforming. Secondly, many of the emerging markets economies are reliant on commodities. With demand starting to heat up, inflation is expected to increase which helps countries like Brazil, Peru, and Saudi Arabia. As you can tell, the best idea is to start with with valuations and then look at the cyclical catalysts. The expensive ones with negative catalysts should be sold and the ones with positive catalysts which are cheap should be bought. One final point on international markets is that currency changes are important. Sweden outperformed the U.S. from 2000-2010 by 240 basis points in U.S. dollar terms starting with an almost double Shiller PE, but in local currency terms the performance was almost even.

Forecasts For Emerging Market Growth
Cyclically America Looks Challenging
Some say the Shiller PE can stay high because, unlike the last two cycles, earnings are accelerating when it’s high. The chart below shows the argument why earnings might not have much room to run. The trailing 12 month EBITDA margins are the highest in at least 23 years while the ex-energy and ex-financial capital turnover has been decreasing. Firms are ineffectively utilizing their working capital. Furthermore, the return on invested capital has fallen by about 2% from the peak in 2014 which was near 16%. This all signals the easy pickings for profit growth have already occurred. The earnings growth is on its last legs this cycle.
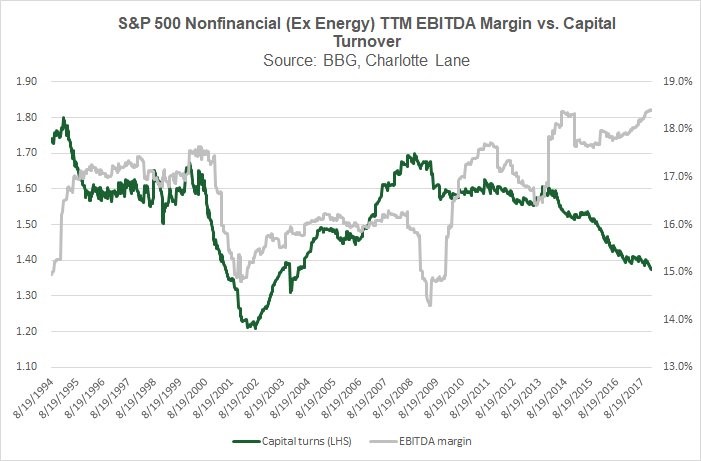
Heightened Margins But Declining Capital Turnover
Conclusion
There are legitimate arguments for why stocks can go higher in the long term even though stocks are expensive. In the best case, the Shiller PE gives an estimate for where returns will be. Because of this uncertainty, there’s room for interpretation. Small changes in index weighting or interest rates can cause equities to remain on their uptrend instead of stagnating. For now, you have the arguments for why US stocks should be avoided. Besides going to cash or owning commodities, you can go long emerging markets if you think the S&P 500 will underperform.
Have comments? Join the conversation on Twitter.
Disclaimer: The content on this site is for general informational and entertainment purposes only and should not be construed as financial advice. You agree that any decision you make will be based upon an independent investigation by a certified professional. Please read full disclaimer and privacy policy before reading any of our content.


