UPFINA's Mission: The pursuit of truth in finance and economics to form an unbiased view of current events in order to understand human action, its causes and effects. Read about us and our mission here.
Reading Time: 5 minutes
On average there are 3.3 five percent corrections per year. 2017 was an odd year with record low volatility where there weren’t any corrections as stocks went up in almost a straight line. 2018 has been a return to the average as there have been 3 corrections so far. If you’re a long-term investor, it’s not a good idea to panic during every correction because most end quickly. You shouldn’t change your process based on small movements in stocks. If you don’t check your portfolio every minute normally, don’t start checking excessively because stocks are falling. Do macro, sector and company research and form a view. Downside market volatility could be a blessing or a curse, all that matters is your perspective. Here’s a good article (we think so) discussing the merits of reviewing macro, sector and/or company specific information in best determining and structuring your view of the world.
A correction is like the stock market testing to see if a recession is coming. Most of the time it ends up being a failed test which is why stocks rebound. This article will review some of the negative catalysts blamed for the October 2018 correction. Obviously, a new catalyst can steal the spotlight and cause a crash, but it’s still a good way to determine if this correction is about to turn into a bear market or not.
Housing Affordability
Housing market weakness is one of the most important negative catalysts for this correction. GDP growth is on pace to be 3.3% in Q3 after growing 4.2% in Q2. The unemployment rate is low, nominal wage growth is accelerating, and consumer sentiment is high. Even with that solid back drop, housing has been weak. This proves how unaffordable prices have become. This is the result of years of shelter CPI rising above the overall headline reading. Without shelter inflation, overall inflation would have been lower this cycle. The problem is shelter is the biggest cost consumers face.
We like to look at every way to measure housing affordability to make it as easy as possible to understand. The time it takes for the median household to save for a 20% down payment on a house is a unique way of measuring the relationship between incomes and house prices. In 1988 it took 5.7 years to save for a down payment and now it takes 7.2 years. This partially explains why it is taking longer for millennials to form households.
First time home buyers say 46% of their down payments comefrom savings. It’s 35% for repeat buyers. The two other most popular ways to acquire funds are through gifts and selling financial assets like stocks, bonds, mutual funds, or assets in retirement accounts. The average person doesn’t put 20% down on a house; this exercise just shows how difficult it has become to save for a house.
As you can see from the Zillow chart below, in San Jose it takes 13.3 years longer to save for a down payment than it did in 1988. San Jose is so unaffordable median down payments in Q2 2018 were $306,000. That’s even higher than San Francisco which is $220,000.
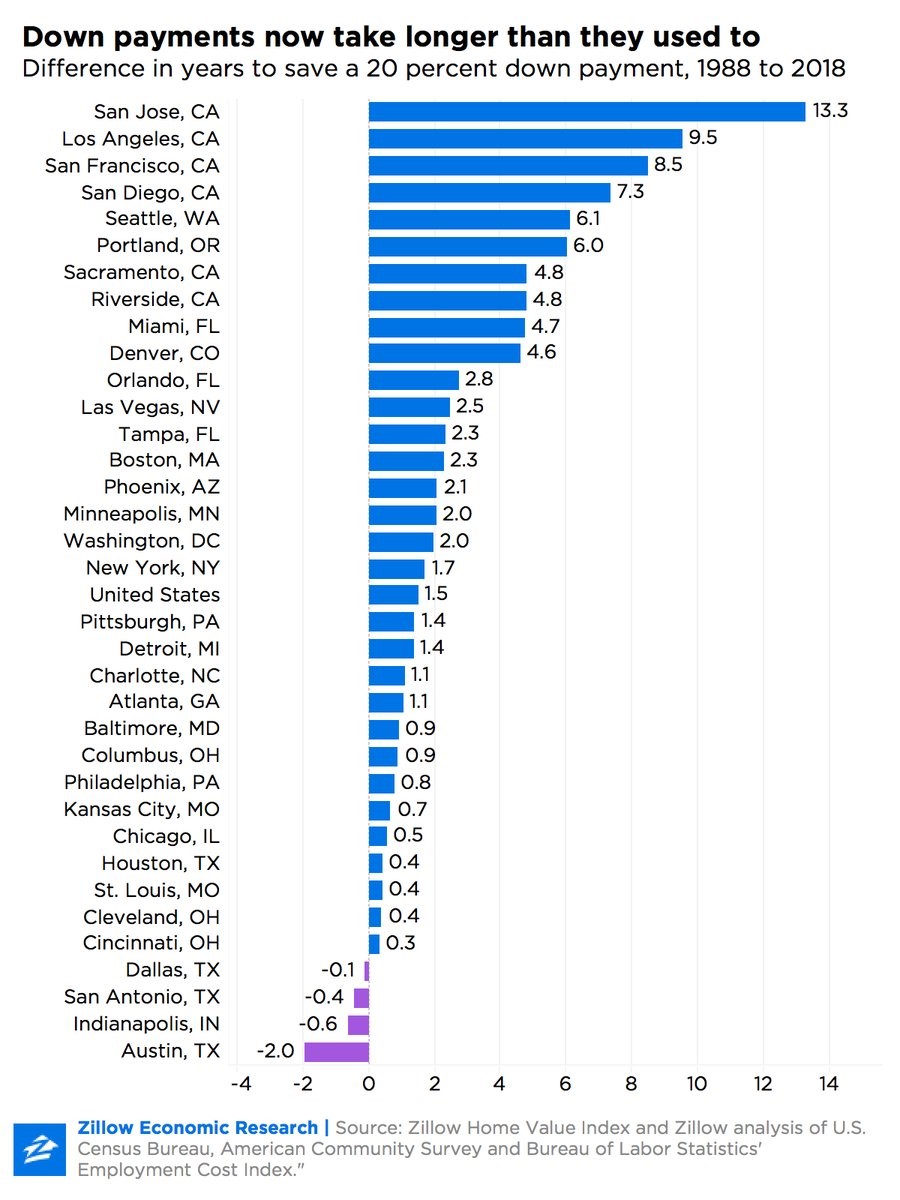
These expensive areas usually have higher wages than the national average, but affordability is still a big problem. Only Dallas, San Antonio, Indianapolis, and Austin are more affordable than 30 years ago. Overall rents are also less affordable as typical households used to spend 25.8% of their income on rent, but now rent takes up 28.4% of household income.
Tariffs Will Hurt GDP
The Fed is hiking rates close to the long run rate, making for hawkish policy. The fiscal stimulus is losing its effect after bolstering Q2 GDP growth. More serious tariffs are being imposed and even worse ones are being threatened. America made a trade deal with Canada and Mexico, but is still at war with its largest trading partner which is China. President Trump was able to issue small tariffs in the first half of 2018 without much of an impact because the American economy was rising on a temporary benefit from the fiscal stimulus.
Once the 25% tariff rate on Chinese goods, which will be levied if there’s no trade deal with China by the start of 2019, and the 25% tariff on auto imports are enacted, GDP growth will be noticeably hampered by the trade war. This explains why industrial stocks have underperformed the S&P 500 recently. As you can see from the chart below, the tariffs will hurt GDP by 1%.
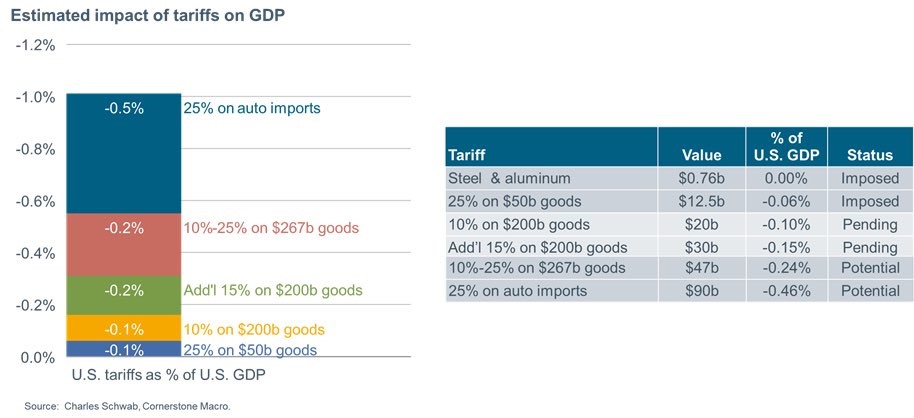
Just because the steel and aluminum tariffs haven’t impacted inflation and growth doesn’t mean you should ignore the potential large effect in 2019.
The chart below shows the average effect trade war news has had on stocks going back to 2016.
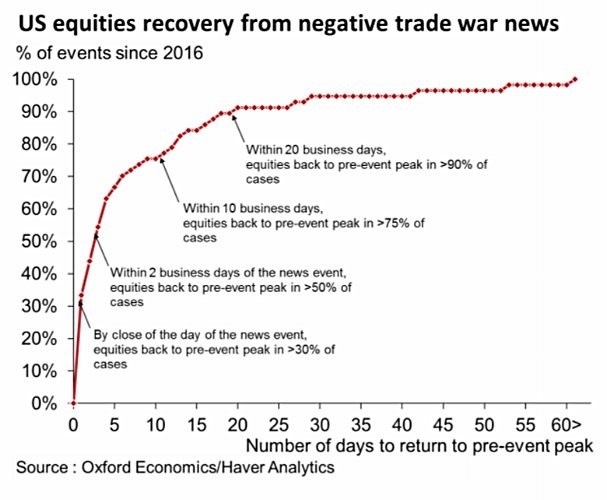
This analysis tracked 70 trade news events. The S&P 500 recovers over 90% of its losses after 20 trading days. However, you can’t just take this as an all clear to buy stocks. Once the tariffs start to hurt economic reports, the stock market will fall again like it has in October.
S&P 500 Earnings Results
Earnings have helped save stocks from falling into a deeper correction. However, the positive trends this year are starting to reverse. As you can see from the tables below, after the first 84 S&P 500 firms have reported Q3 results, estimates for Q4 earnings have fallen 0.67%. That’s better than the 3 year average which is -0.89%, but this is a continuation of a 3 quarter trend of worsening guidance.
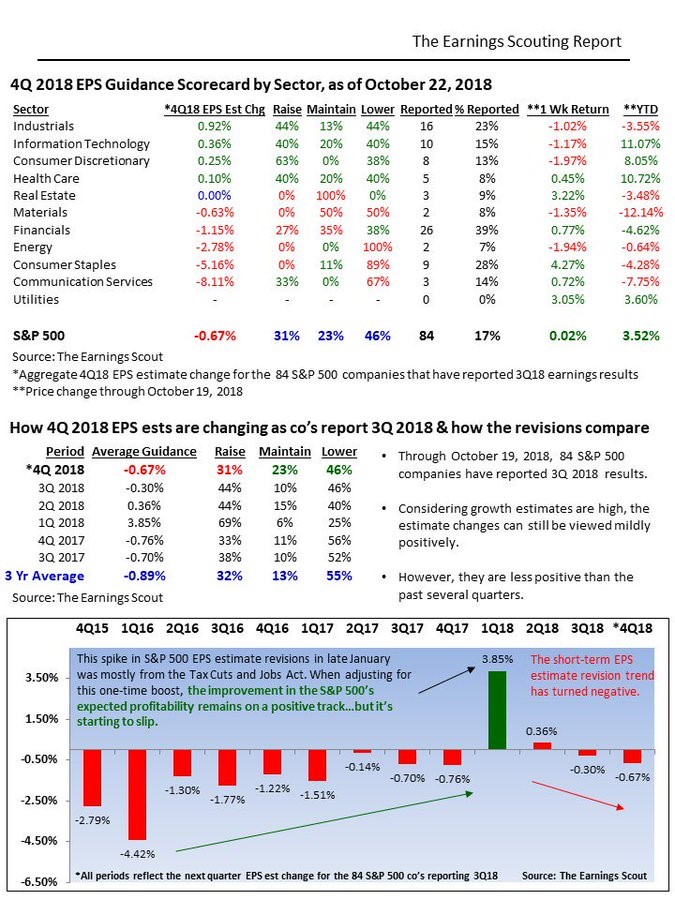
31% of firms have pushed up earnings estimates which is below the 3 year average of 32%. If this trend continues in the next quarter, it might be worse than the 3 year average.
Economic Indicators
The table below gives a neat summary of the leading economic indicators to help us look out for a recession.
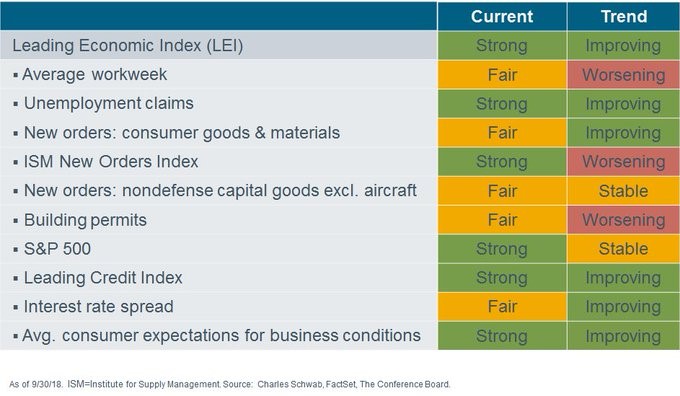
All current leading indicators are fair or strong. 6 are strengthening and 3 are weakening. The leading economic indicators are up 7% year over year. In the past, when the economic indicators peak, it takes an average of 16 months for a recession to occur. If that continues, there won’t be a recession in 2019 because they are at a record.
Conclusion
Housing is weak because prices have risen quicker than incomes. The tariffs and rates hikes are negative catalysts to look out for in 2019. Earnings growth in Q3 is very strong, but the trend of declining estimates for the subsequent quarter is disconcerting. According to the leading indicator summary which is currently at record highs, it suggests that there probably won’t be a recession in 2019.
Have comments? Join the conversation on Twitter.
Disclaimer: The content on this site is for general informational and entertainment purposes only and should not be construed as financial advice. You agree that any decision you make will be based upon an independent investigation by a certified professional. Please read full disclaimer and privacy policy before reading any of our content.


