UPFINA's Mission: The pursuit of truth in finance and economics to form an unbiased view of current events in order to understand human action, its causes and effects. Read about us and our mission here.
Reading Time: 5 minutes
Most of our articles are fundamental assessments on the drivers of equity prices. In late-October 2018, it’s specifically pertinent to bring this up because there has been increased downside volatility in U.S. equities. Corrections are tests to see if the economy is about to fall into a recession. It’s difficult to time corrections, but since the fundamentals always drive prices, we believe proper analysis can determine the probability of a recession and bear market. Most corrections end quickly as the bull market keeps going, but that’s not enough to justify buying stocks heavily after they fall about 10%.
Back To The Housing Market
Weakness in the housing market isn’t the only catalyst of the correction in stocks, but the size of this asset on the consumer’s balance sheet makes it pivotal. We don’t have to go back far to show an example of the damage the housing market can do to the economy. While another 2008 financial crisis is unlikely because lending standards have improved, we’re mentioning it to show the power of housing. When prices go up, consumers are more willing to spend money because their wealth has increased. Underwater mortgages, which is when the value of the home is less than the value of the mortgage, are terrible for consumers. Luckily, the number of underwater mortgages is falling. As of Q4 2017, the rate of underwater mortgages fell to 9.1% which is the lowest since the financial crisis.
New Buyer’s Market Coming?
The current problem isn’t underwater mortgages; it’s housing affordability. According to a Zillow survey of real estate economists, the housing market won’t shift to a buyer’s market until at least 2020. 43% said it would shift in 2020 and only 25% said it had shifted already or would shift by 2019. This survey is referring to the national market. Some people believe by the time a realtor or economist is warning home owners that a buyer’s market is coming soon, the buyer’s market is already there, meaning the experts are behind the curve.
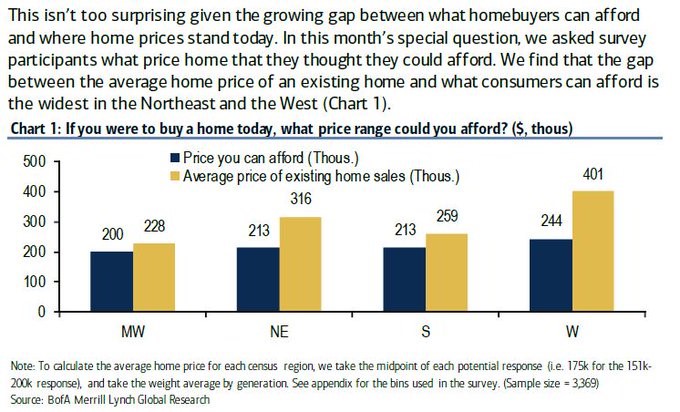
It wouldn’t surprise us to see a buyer’s market before 2020 because housing has become unaffordable especially for millennials trying to buy their first home. Interestingly, the percentage of first time home buyers dipped to 33% according to the National Association of Realtors. The lowest of this cycle was 32% in 2015. The lowest since 1981 was in 1985 when it fell to 30%. As you can see from the Bank of America Merrill Lynch chart below, the prices people said they can afford are way below the average existing home prices in each region. The biggest disparities are in the west and northeast. Housing prices are 64% higher than consumers say they can afford in the west and 48% too high in the northeast.
Latest Housing Reports
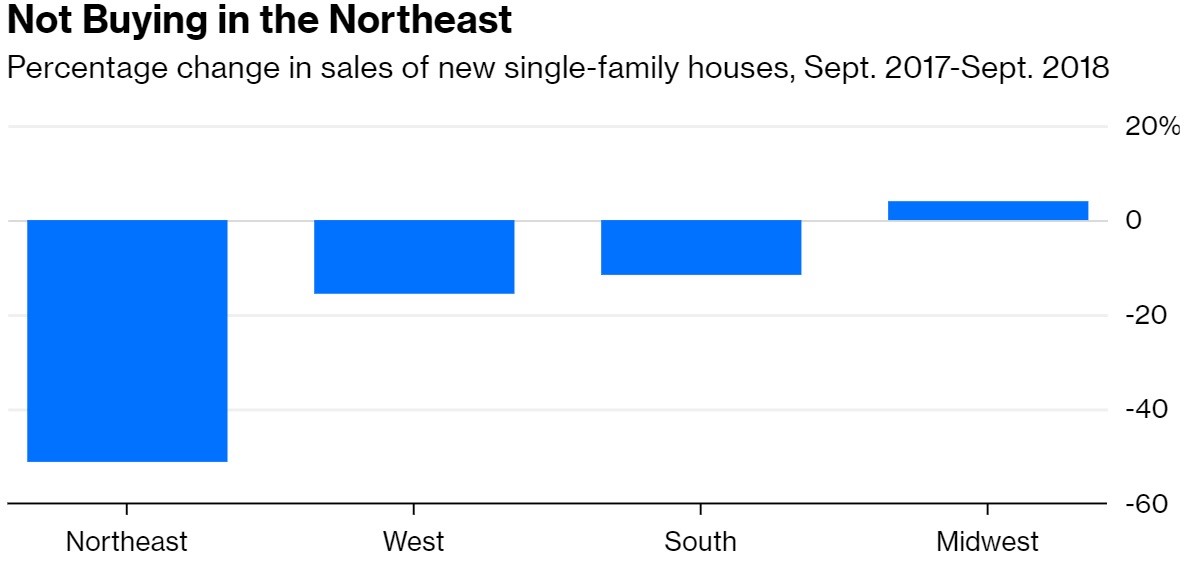
The affordability rankings are correlated with the year over year new single family home sales seen in the chart below. New home sales fell approximately 13.2% which is the worst reading since April 2011. They fell 51.3% in the northeast, 15.8% in the west, and 11.4% in the south. They rose 4.1% in the Midwest which had the lowest disparity between affordability and prices in the Merrill Lynch survey.
The Q3 GDP report also didn’t have good news for housing. Residential investment fell 4% which was the 3rd straight decline. That’s the longest losing streak since late 2008 to early 2009. Even with this weakness, real consumer spending growth was 4% which drove the 3.5% Q3 GDP growth. The strength of the labor market likely will tell us whether the consumer can withstand weakness in housing while still increasing its real spending which is needed to drive GDP growth.
Record Difference Between Value & Growth
One of the most prominent trends in this bull market is growth stocks have outperformed value stocks. Noted value investor David Einhorn, who had a great track record of returns, has done poorly in the past few years because investors are infatuated with growth stocks, which are mostly internet names. This isn’t another tech bubble like the 1990s because these internet names have earnings. However, it’s fair to wonder if growth will continue to outperform value. As you can see from the chart below, the spread between Russell 1000 growth and value recently hit a record high.
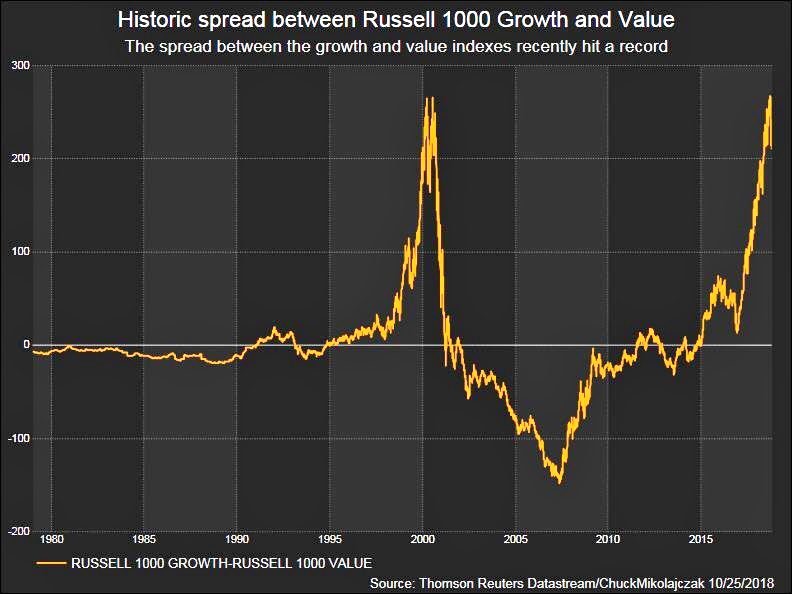
In October, growth stocks have fallen 10% and value stocks have fallen 7%, possibly indicating the cyclical trend is about to reverse. The big new headwinds the mega-internet names face are increased regulations and taxation.
Earnings Guidance Predicted October Decline
One fundamental indicator which correctly predicted the volatility in October was the relative EPS revisions. The chart below shows when there were high negative earnings revisions and low positive revisions in January and September, the S&P 500 hit its peak.
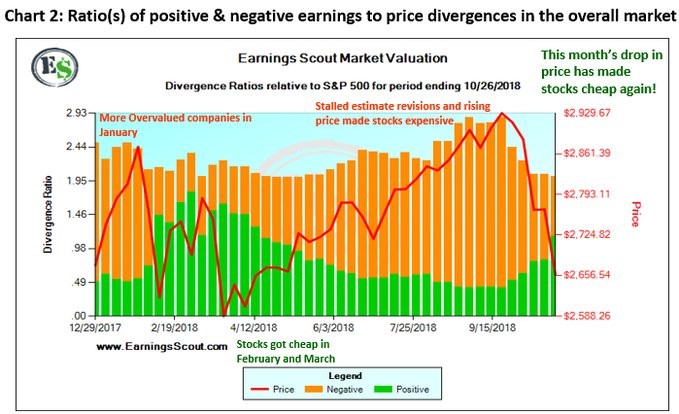
There has recently been a slight rebound in revisions, while stocks have fallen which is a bullish indicator like what occurred in February and March. The disconcerting trend in revisions is future estimates have been falling at an accelerating pace in the past 3 quarters. Q1’s earnings estimates rose 2.74% as they were boosted by the tax cut and cyclical economic growth. Q4 EPS estimates have fallen 0.87% and the results won’t come out for a few weeks. Earnings estimates usually fall leading up to the quarter, but that doesn’t take away from the fact that the trend is negative.
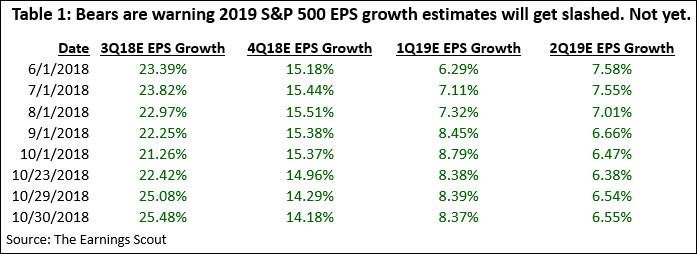
The most important aspect of Q3 EPS results is what they mean for future estimates, not how many firms are beating estimates. Even in recessions, more firms can beat EPS estimates than miss them. The table below shows Q4 estimates have fallen, but 1st half 2019 estimates have remained steady during the October correction. That’s a positive sign.
Conclusion
The health of the consumer and corporate earnings determine where future stock prices are headed. Consumer spending growth was strong in Q3, but the negativity in housing has continued. Corporate earnings growth is strong in Q3, but Q4 estimates are falling. The recent improvement in revisions can help form a short term bounce in stocks, but the concerns of weakening global growth, trade wars, a hawkish Fed, and the weakening effect of the stimulus need to be solved before stocks can rally higher in 2019. It’s interesting to see how value stocks have finally started outperforming growth names in this correction.
Have comments? Join the conversation on Twitter.
Disclaimer: The content on this site is for general informational and entertainment purposes only and should not be construed as financial advice. You agree that any decision you make will be based upon an independent investigation by a certified professional. Please read full disclaimer and privacy policy before reading any of our content.


