UPFINA's Mission: The pursuit of truth in finance and economics to form an unbiased view of current events in order to understand human action, its causes and effects. Read about us and our mission here.
Reading Time: 5 minutes
Before we review the preliminary Q3 GDP growth report, it’s important to recognize America’s relative outperformance in rate of change terms over the global economy. 2018 has been a fantastic year of rate of change outperformance for America as growth accelerated partially due to the fiscal stimulus while growth slowed in the rest of the world. The chart below is a great depiction of this.
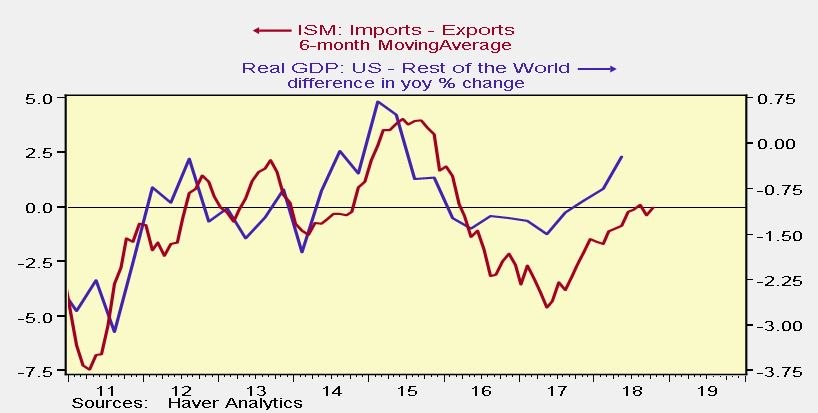
Real GDP growth in America is almost the same as the rest of the world. This is after growth was about 1.5% slower in America in mid-2017. The US has underperformed since early 2015. The 6 month moving average of the ISM imports shows similar information. It’s important to avoid the negative talk about how the manufacturing PMI fell from September to October, because there are random vacillations from month to month. This survey has a small sample size. The October PMI was still consistent with 4.5% GDP growth, so it was far from a bad report.
Very Long, But Subdued Economic Recovery
The negative chatter about the economy has gotten strong because of the correction in stocks. The same prognosticators who didn’t predict the correction are claiming it proves a recession is coming. That’s unlikely to be true in the intermediate term as the truck tonnage index recently hit a record high and the employment cost index is at a 10 year high. Both historically peak more than 6 months before the S&P 500. As you can see from the chart below, this is about to be the longest expansion since the 1800s (chart only demonstrates up until 1949). However, annualized real GDP growth is the lowest out of the expansions listed.
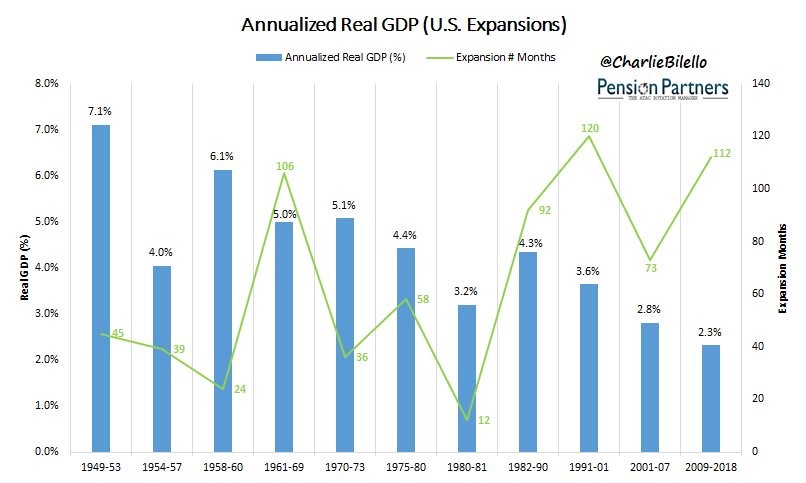
Total growth is only middling despite the length of this expansion. The September PCE report showed both headline and core inflation are at the Fed’s target of 2% which suggests the economy isn’t running hot.
Q3 GDP Growth Beats Estimates
The preliminary Q3 GDP report will be revised, which means the final results won’t be exactly what we discuss here. However, it’s still an important report to review because by the time the final results are out, everyone is focused on the next quarter. Real quarter over quarter GDP growth was 3.5% which beat estimates for 3.3%, but slowed from 4.2% last quarter. The price index was up 1.7% which missed estimates for 2% and last quarter’s increase of 3%. Real consumer spending growth was the star of this report as it was 4% which beat estimates for 3.3% and last quarter’s growth of 3.8%.
Strong Consumer Spending Growth & Government Spending
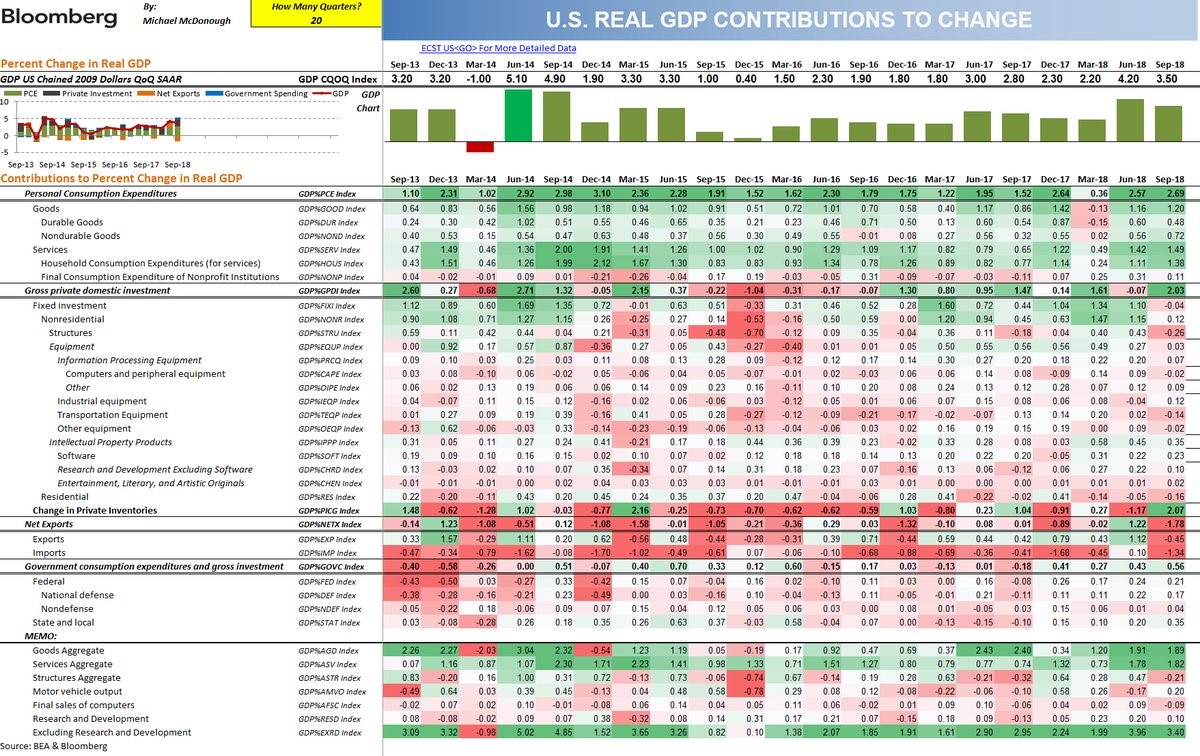
The table above is a complete summary of the Q3 GDP report. We’ll be highlighting the most important parts. The biggest positive was consumer spending growth as it added 2.69% to GDP growth. This was the best figure since Q4 2014 where consumption added 3.1% to GDP growth. These past two quarters are like a slightly weaker version of Q2 and Q3 2014. That was the peak of the last mini cycle. There have been a few mini cycles in this expansion.
Government spending also was strong as it increased 3.3%. The chart below shows this is the 4th straight quarter of spending growth.
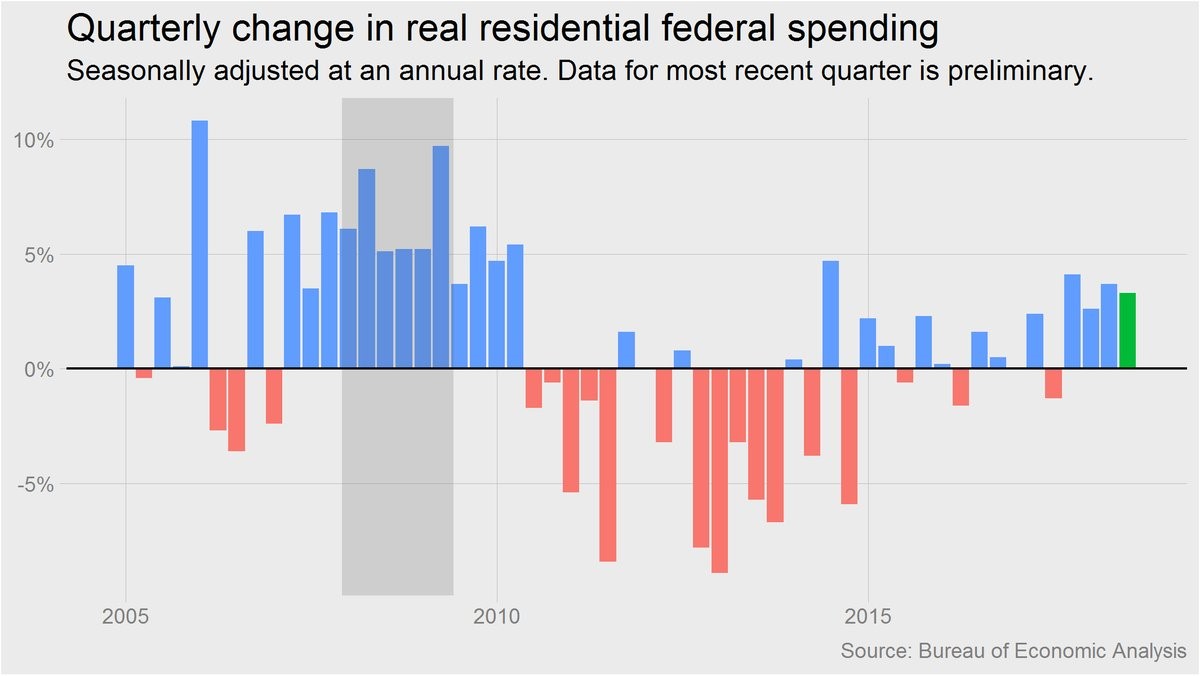
This shows the recent fiscal expansion as increased spending was paired with tax cuts. Generally, it makes sense for the government to increase spending during recessions and pullback during expansions to smooth growth. The chart shows this happened up until this latest run. It’s not ideal to increase spending and the deficit when the economy is nearing full employment. Full employment is when the government generates cycle peak revenue. Government expenditures added 0.56% to GDP which is the biggest addition since Q1 2016 when it added 0.6% to growth. This level of help to GDP growth explains why investors are worried about what will happen when the fiscal stimulus runs its course.
Trade & Inventory Mess
Trade and inventories had a big effect which canceled each other out mostly last quarter. The same thing happened in Q3 except the roles reversed. In Q2 inventories hurt growth by 1.17% and in Q3 inventories helped growth by 2.07%. In Q2 net trade helped growth by 1.22% and in Q3 it hurt growth by 1.78%. There was a big increase in soybean exports which got ahead of the tariffs in Q2 which drew down inventories. The numbers reversed in Q3. There is always a big surge in activity right before tariffs go into effect. Since those don’t have anything to do with the long term growth trend, we have the chart below which excludes them.
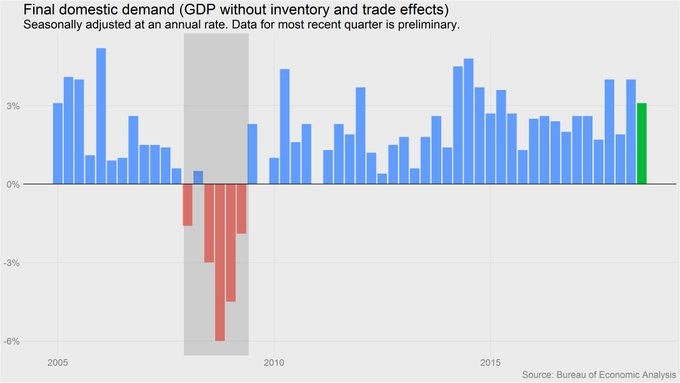
It’s interesting to see the lack of negative growth quarters in this expansion, since there have been some when you include all the data.
Weakest Part Of The Report
Since growth fell from Q2 and consumer spending growth increased, you knew there were negative factors weighing down growth. The two big negatives were real residential investment and business investment. As the chart below shows, real residential investment growth was -4%.
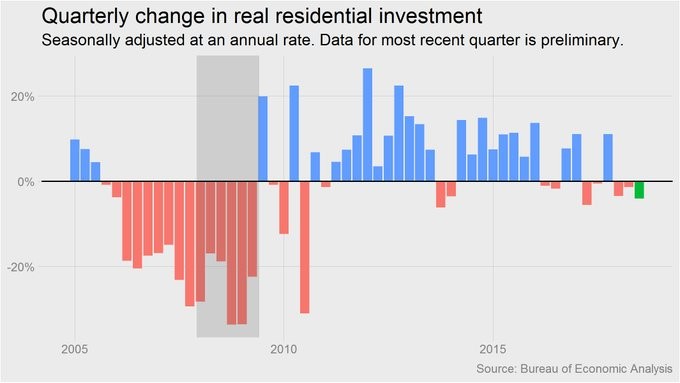
This is the first 3 quarter losing streak since the recession. Residential investment hurt growth by 0.16% which is the biggest hit since Q2 2017. This weakness highlights the weakness in the housing sector.
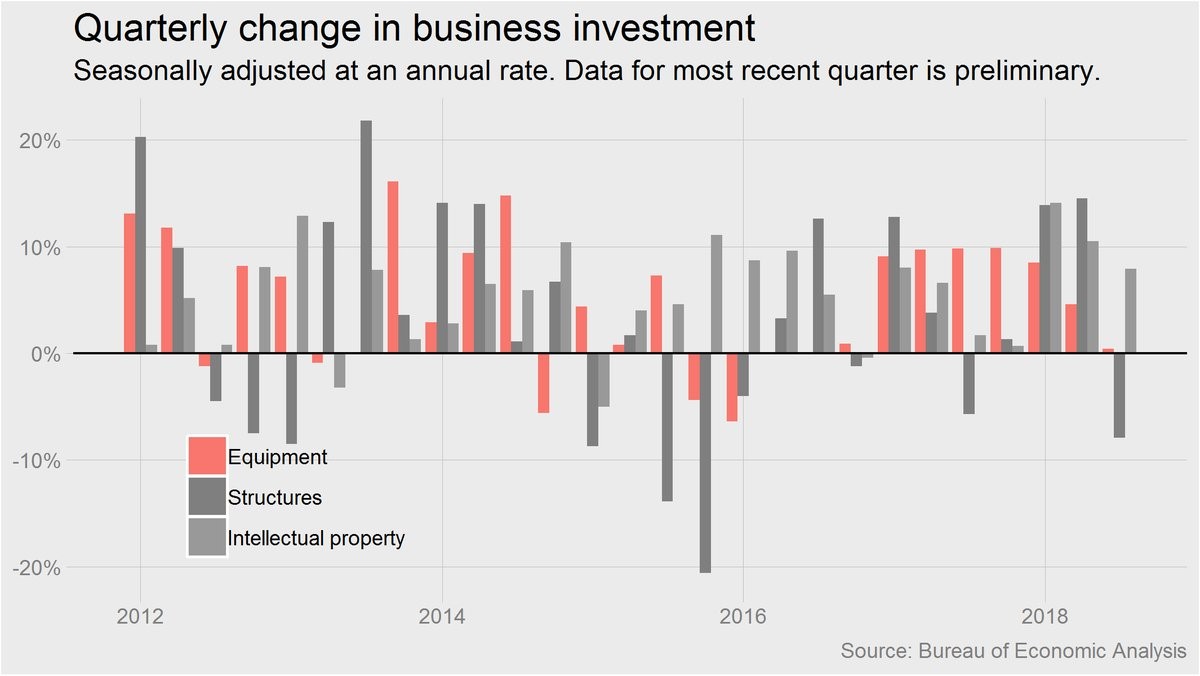
Business investment was a major soft spot of this report as it grew 0.8%. With record earnings and capital being repatriated from overseas, you’d think growth would be strong, but it may have peaked. It grew 8.7% in Q2 and 11.5% Q1 showing how fast it faded. The chart below shows a breakdown among the categories of business investment. Equipment helped GDP growth by 0.03%, structures hurt growth by 0.26%, and intellectual property helped growth by 0.35%.
Conclusion
The Q3 GDP report showed consumer spending growth accelerated, government spending growth was strong, residential investments shrunk, and business investment growth sharply decelerated. That’s a mixed bag which led to a solid growth rate of 3.5%. The coming real wage growth acceleration should boost consumer spending into the holiday season. However, the consumer is all the economy has right now as global growth is slowing and businesses are falling off the high that was created by the tax cut and temporary overseas capital repatriation holiday.
Have comments? Join the conversation on Twitter.
Disclaimer: The content on this site is for general informational and entertainment purposes only and should not be construed as financial advice. You agree that any decision you make will be based upon an independent investigation by a certified professional. Please read full disclaimer and privacy policy before reading any of our content.


