UPFINA's Mission: The pursuit of truth in finance and economics to form an unbiased view of current events in order to understand human action, its causes and effects. Read about us and our mission here.
Reading Time: 5 minutes
The housing market is much slower moving than equities since stocks have high liquidity. While it seems like a bad thing when stocks are falling and it’s in all the headlines, liquidity is a positive. Not being able to find a buyer for your real estate will cost you either time or money, meaning you can wait for someone to pay your price or lower the asking price to make a deal.
Rising interest rates are a negative catalyst the housing market didn’t need. Even though the labor market has been strong and real wage growth has been solid recently, housing has recently started to struggle because it outperformed wages for too long. Rising rates are a sign the economy is returning to normal growth, but they can also be the reason behind a decrease in the elevated housing prices, which are in some local markets outright bubbles.
As you can see from the chart below, the affordability gap has risen in the past 6 years.
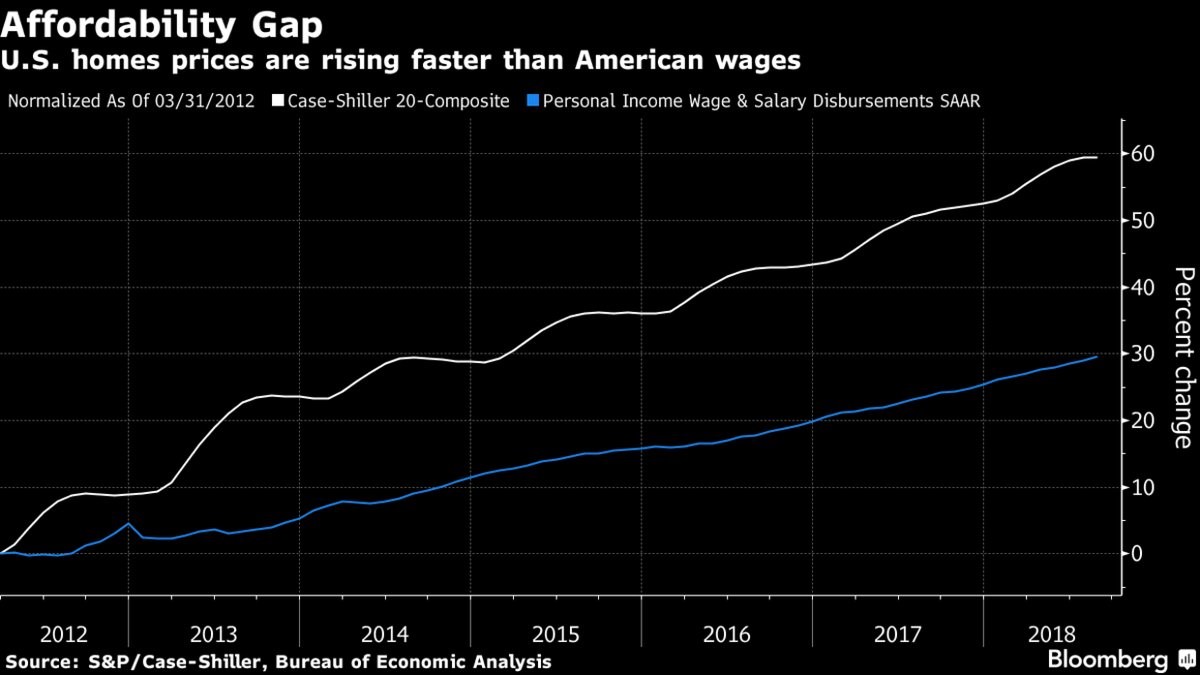
The 20 city Case Shiller composite index is up about 60% since March 31st 2012 which is about double the growth in personal income wage and salary disbursements. Some areas can sustain high prices because their city has faster wage growth or encourages outsiders to invest. In the long run, wages and population growth are the main aspects that sustain home prices.
Changes in interest rates can have a massive impact on monthly mortgage payments, and thereby the affordability of a house. The chart below breaks down the changes in affordability caused by the spike in interest rates from 4% to 5%.
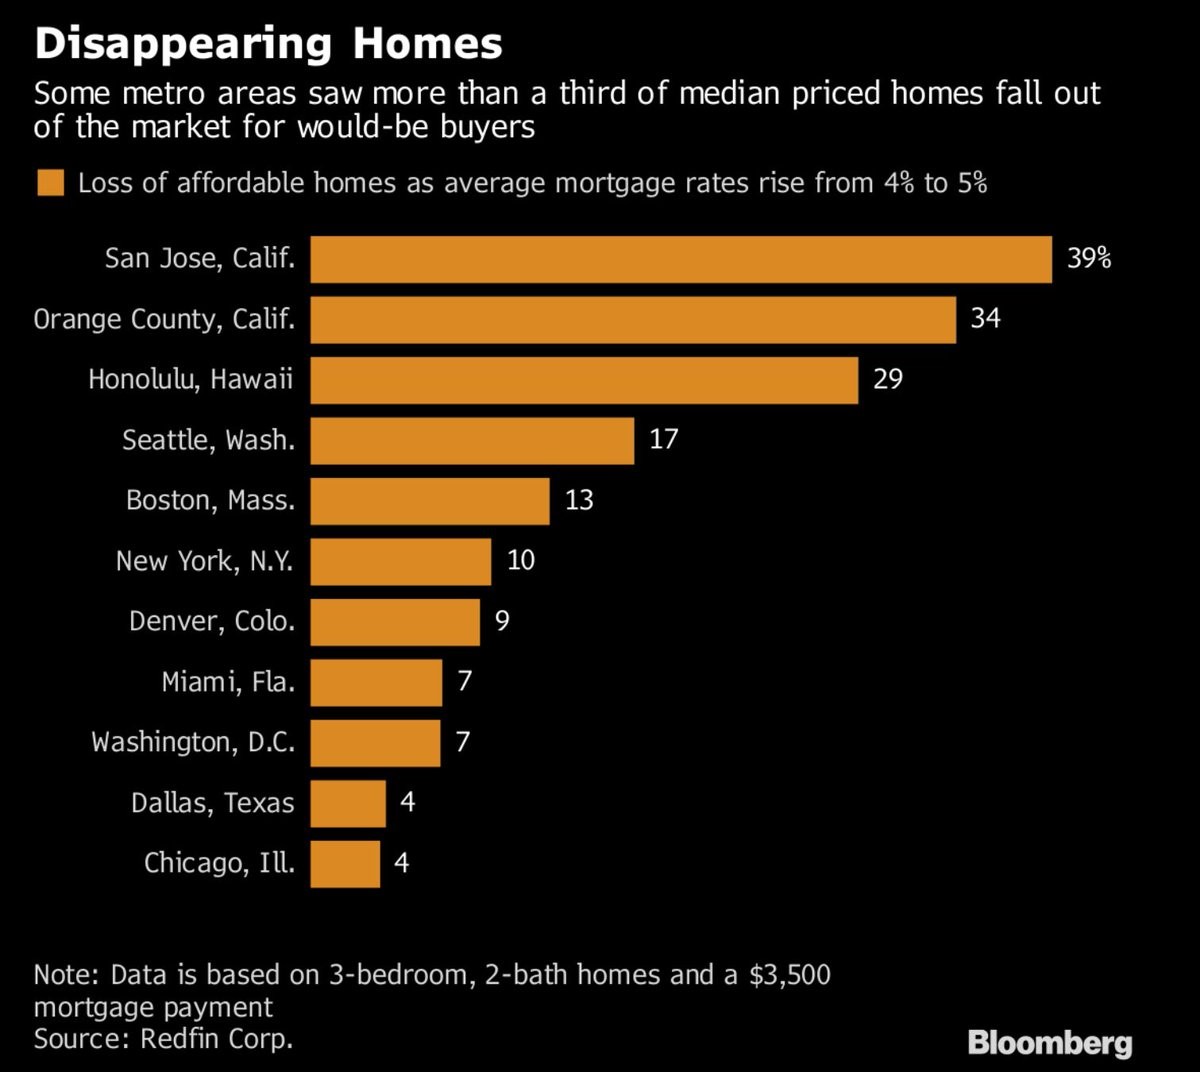
San Jose, which has the highest mortgages because it is extremely expensive, saw 39% of houses fall out of the market for would-be buyers.
Real Estate Is About Location
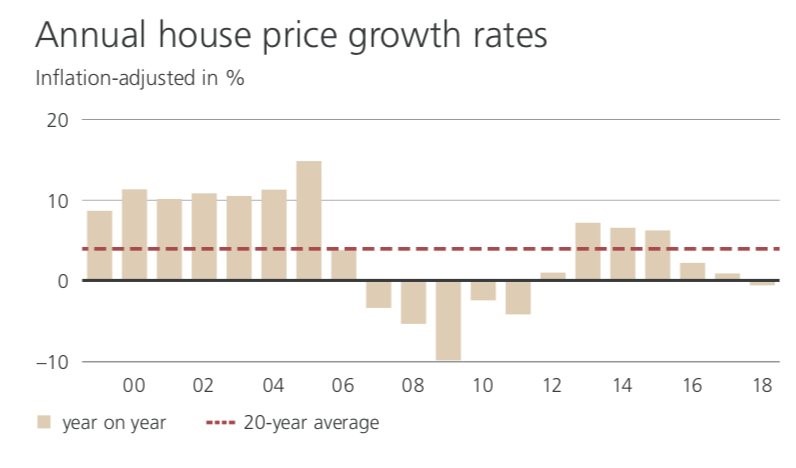
The current weakness in housing is a combination of a lack of affordability and rising rates. The other hot markets in this expansion, which are Seattle and Denver, saw 17% and 9% of houses drop out of the affordability range. New York hasn’t had a hot housing market since its Case Shiller index hasn’t reached the 2006 bubble peak, but even it lost 10% of its houses. As the chart below shows, real New York housing prices have fallen in 2018. Real price growth has been below the 20 year average since 2016.
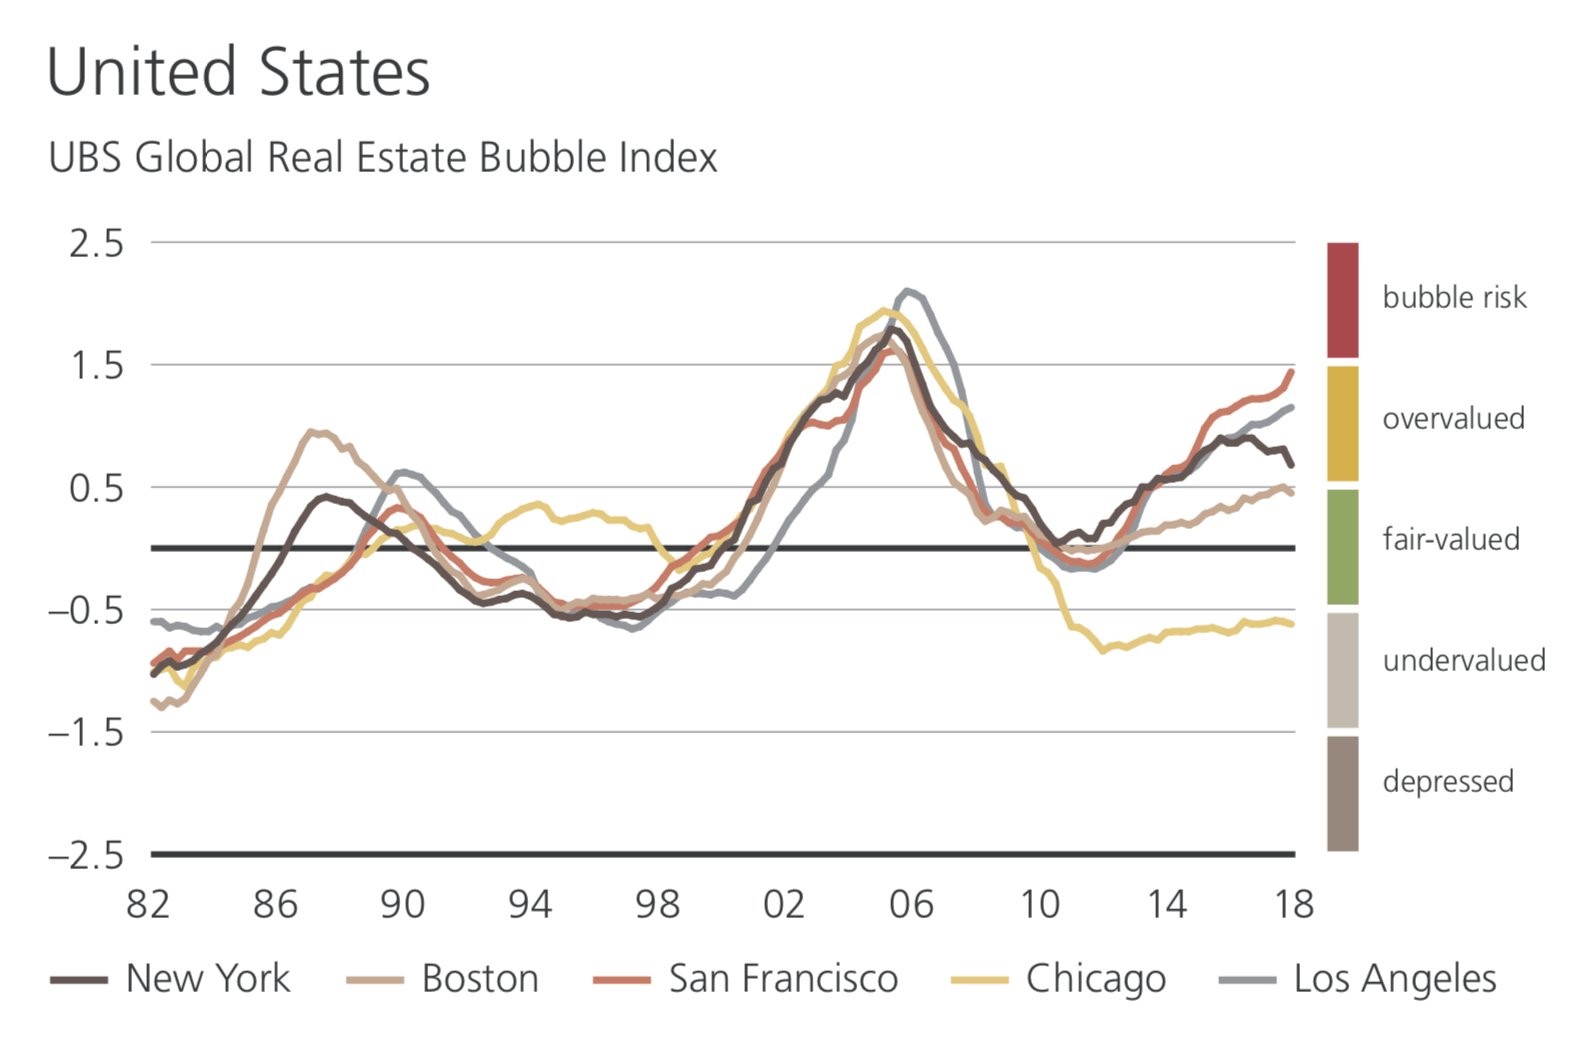
The chart below shows UBS’s take on the real estate markets in 5 of the top American cities. As you can tell, Chicago is undervalued, Boston is fairly valued, New York is slightly overvalued, Los Angeles is overvalued, and San Francisco is near bubble levels. We’d expect to see Seattle and Denver near San Francisco in this chart if they were included.
Weakness In The Home Price Index
The August home price index report, which includes the Case Shiller 20 city index, was released late October. It showed more of the same weakness we’ve been seeing in most of the housing reports this year. On a month over month basis, the 20 city index was up 0.1% on a seasonally adjusted basis. This met estimates and was the same as July. Home prices are flatlining on a sequential basis. On a non-seasonally adjusted basis, prices didn’t change month over month which was down from 0.3% growth in July.
On a year over year basis, the 20 city index was only up 5.5% non-seasonally adjusted. This was below the low end of the consensus range of 5.7%. The average estimate was for 6% growth. July had 5.9% growth. The growth in August was the lowest since December 2016. March had 6.8% growth, showing us how much growth has fallen in the past 5 months.
Seattle showed signs of topping as it had a 1% month over month decline and a 9.6% year over year increase. San Diego also fell as it was down 0.3% month over month and up 4.8% year over year. San Francisco prices were up 10.6% year over year, for the 2nd highest growth rate. Las Vegas is taking the helm as the hottest real estate market of the summer as prices were up 1.1% month over month and 13.9% year over year. The bottom 3 cities were Chicago, New York, and Washington D.C. which were up 2.9%, 2.8%, and 2.8% year over year, respectively. Nationally, the home price index was up 5.8% year over year which was the weakest growth since mid-2017. As you can see, the big 3 cities we just mentioned pushed the 20 city index’s growth rate below the national rate.
Homeownership Actually Increases
Even though we have mostly painted a negative picture about affordability, there is some information which counteracts that. In the quarterly residential vacancies and homeownership report, it shows the homeownership rate increased from 64.3% to 64.4% in Q3 as you can see in the chart below.
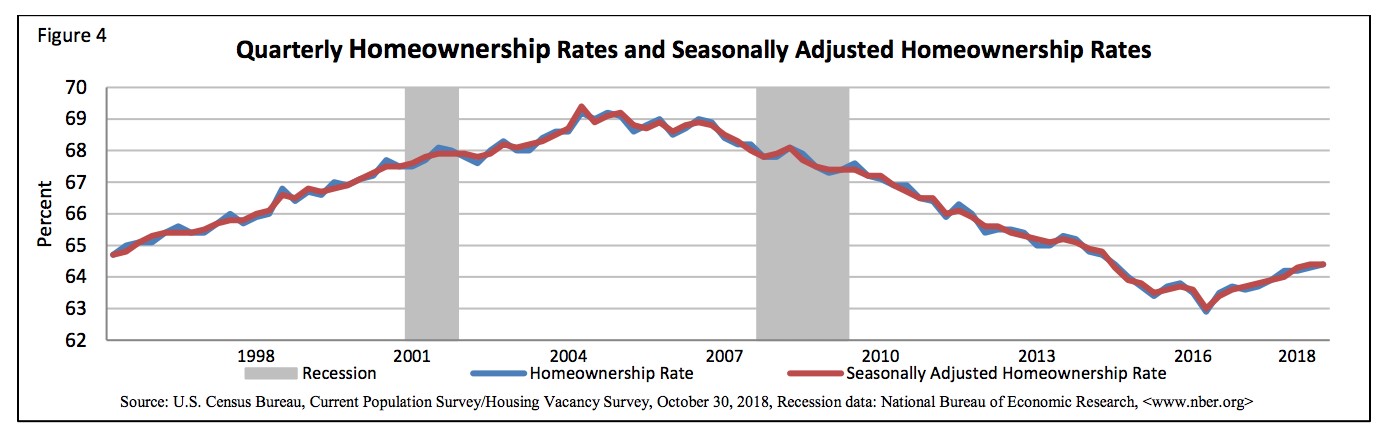
The homeownership rate among those under 35 did the best as their rate was up 1.2% year over year from 35.6% to 36.8%. There was a 0.3% increase from last quarter. The weakest age group was 45 to 54 which fell from 70.6% in Q2 to 69.7% in Q3. The Midwest improved the most on a quarterly basis which makes sense because it has the most affordable housing. It increased from 68.3% to 69%. It also has the highest homeownership rate.
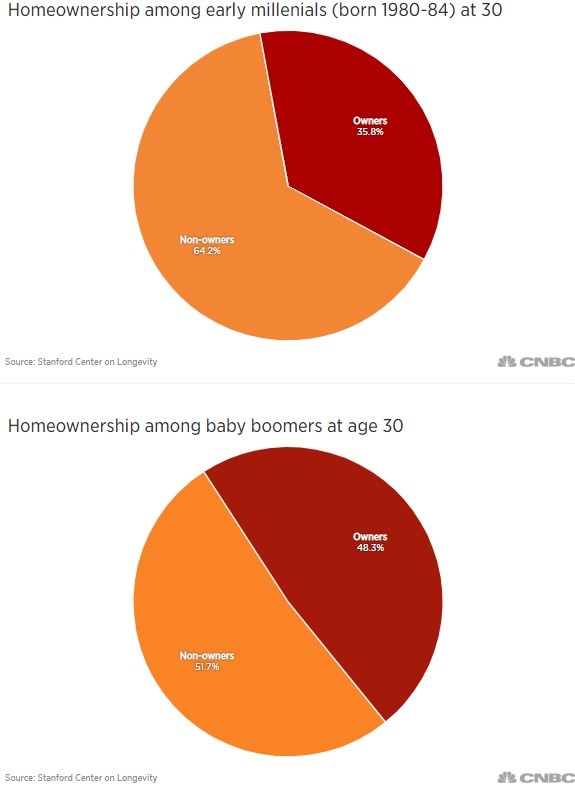
One reason young people may have seen a spike in their homeownership rate in the past year is because they are catching up to previous generations. As you can see from the pie charts below, only 35.8% of early millennials own a home which is significantly below the 48.3% of baby boomers who were homeowners at the age of 30.
Conclusion
Housing is becoming less affordable and price growth is slowing, but the homeownership rate increased slightly. Those seem like contradictions, but they both occurred. The strong labor market explains why the homeownership rate has been increasing since Q2 2016. The rate is certainly hampered by affordability. Weakness in the labor market would be terrible for housing since it’s already weakening even with a decently strong economy.
Have comments? Join the conversation on Twitter.
Disclaimer: The content on this site is for general informational and entertainment purposes only and should not be construed as financial advice. You agree that any decision you make will be based upon an independent investigation by a certified professional. Please read full disclaimer and privacy policy before reading any of our content.


