UPFINA's Mission: The pursuit of truth in finance and economics to form an unbiased view of current events in order to understand human action, its causes and effects. Read about us and our mission here.
Reading Time: 5 minutes
The April jobs report in the US wasn’t great as there were misses across the board. The total jobs created was 164,000 which missed estimates of 191,000. The participation rate missed estimates for 62.9%, coming in at 62.8%. Furthermore, the year over year hourly earnings growth was 2.6% which missed estimates for 2.7% growth. Because the work week was flat at 34.5 hours, this means the weekly earnings growth decelerated from 3.2% in March to 2.9%. These stats aren’t consistent with a tightening labor market. The wage growth is supposed to increase at the end of the labor market cycle as the demand for labor exceeds supply.
The unemployment rate fell from 4.1% to 3.9%. Usually, this means wage growth, Fed rate hikes, and the end of the business cycle. This explains why stocks usually don’t perform well when the unemployment rate is low, especially when it is increasing. We’ll review a potential explanation for the lack of wage growth later in this article.
Education & Age Group Unemployment Rates
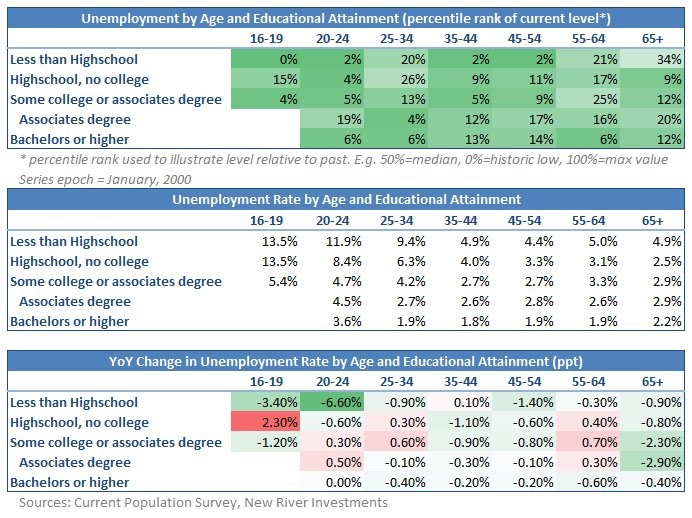
First let’s look at the tables below which show a few cross sections for the labor market, explaining how tight the labor market is.

Source: New River Investments
As you can see in the first table, the percentile is actually lower for the poorly educated compared to the highly educated for those ages 35-54. That’s not surprising because there has been an influx of graduates which makes it difficult for some to get a job. Plus, the manufacturing sector has recently shown strength. The best categories are actually “Less than high school” ages 16-19, 20-24 and 35-54, suggestive that illustrative to the past, unemployment is near historic lows. Most segments, even bachelors or higher have a tight labor market.
The second table clarifies the percentiles seen in the first one. Even though the percentiles are higher for some age groups who are highly educated, the unemployment rates are lower for graduates. The point here is to show that relatively, the poorly educated are doing well. However, it still makes sense to get an education if you want a lower chance of being unemployed.
The final chart shows the recent changes in these categories. The best improvements came for ages 16-24 with less than a high school diploma. Generally, the improvements for the poorly educated come at the end of the labor market cycle. This phenomenon is something which we reviewed earlier in Low Income Wage Growth At End Of Business Cycle. This is why the Fed’s rate hikes in 2018 have recently become politicized. Politicians claiming to support wage growth for the poor want the Fed to delay hikes. The poor are also the least capable of dealing with inflation, so it’s not an easy decision to slow rate hikes as it creates a catch 22 scenario.
“Japanification” Of The Labor Market
As we mentioned, wage growth is supposed to occur when the labor market reaches full employment. Real personal income growth is only 1.5% as of March. The hourly earnings growth which caused inflation fears earlier in the year, missed estimates. We think the best way to analyze the situation is to look at Japan because it has had trouble achieving heightened wage growth. The unemployment rate is 2.5% in Japan, but economists only expect 1% wage growth in 2018.
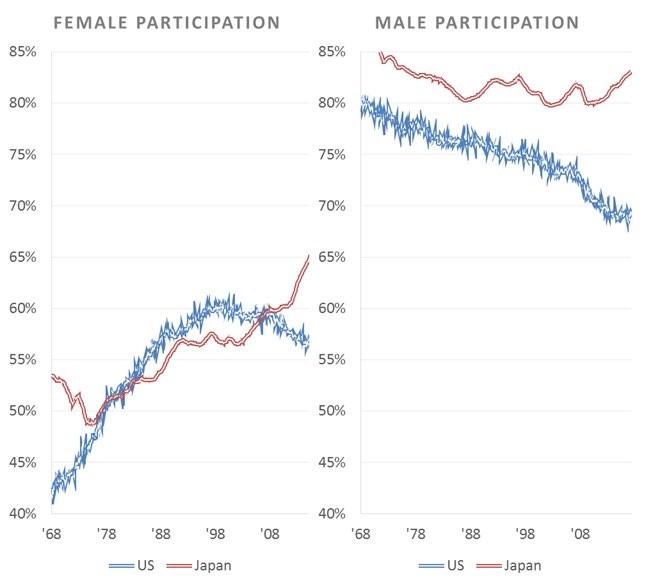
The charts below show that not only is Japan’s unemployment below America’s, but also the labor participation rate is higher.

Source: Twitter @toby_n
Economists blame the decline in the participation rate in the US on the aging demographics. However, Japan has worse demographics than America, yet it’s participation rate is still high. One notable change in the data is the big jump in the participation rate among Japanese women as Prime Minister Abe has encouraged women to enter the work place. This increased the labor market supply which suppresses wages. Also, women are getting jobs that pay less than men, so the average wage is lowered.
Income Growth Is Everything For The U.S. Economy
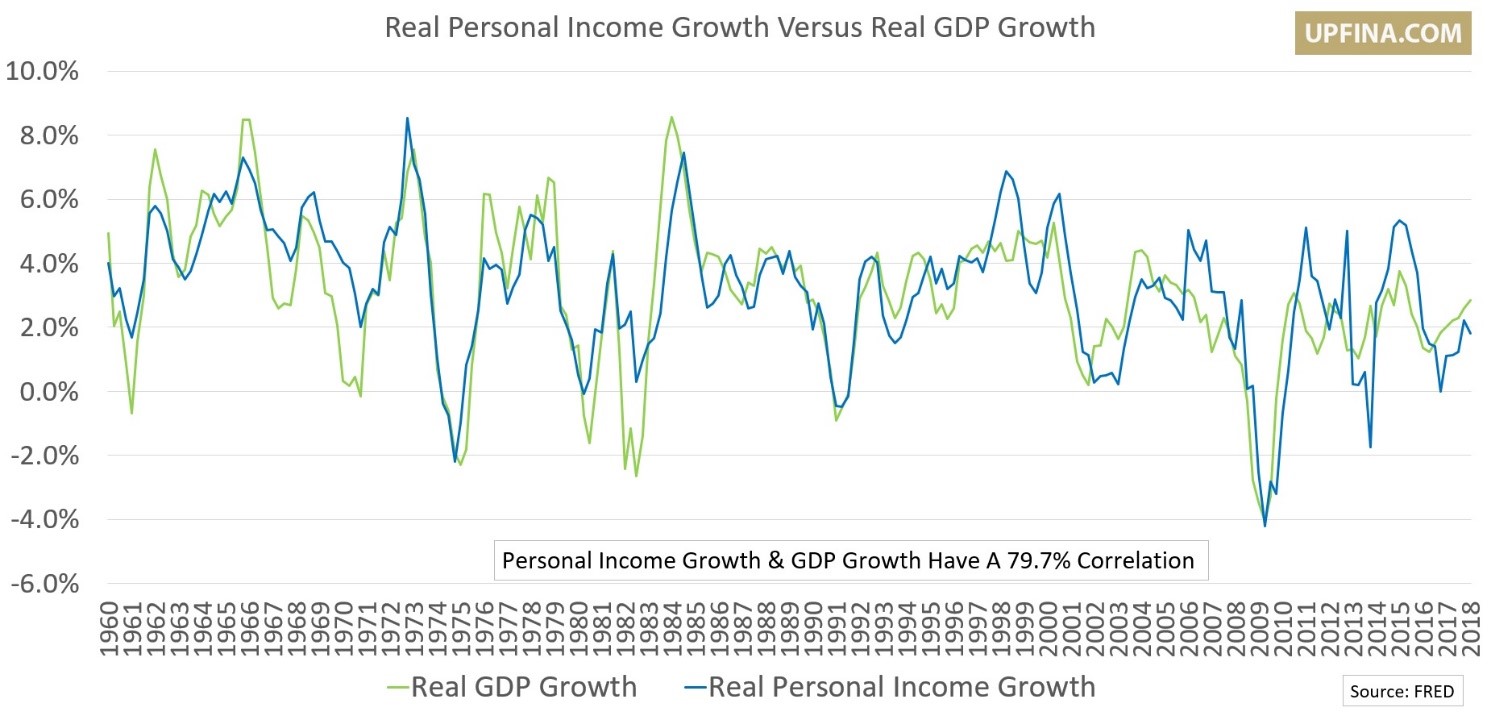
It’s important to understand what wage growth can do to the economy. The chart below shows real personal income growth has a 79.7% correlation to real GDP growth.
Wages and salaries represent 51% of real personal income. The rest of the personal income comes from dividends, interest payments, and transfer payments. The 1.5% growth in real personal income we mentioned earlier doesn’t bode well for economic growth as it has been falling since December. The main difference between income growth and GDP growth is the savings rate. Since the savings rate is already low, there’s not much juice left to squeeze from that fruit. This discussion serves to contextualize the reason why wage growth in the end of this economic expansion is important.
Jobs To Applicants Ratio At A Record In Japan
The chart below is shocking when mentioned in a discussion with disappointing wage growth. It shows the surplus of jobs versus applicants in Japan is the highest since 1973.

Source: twitter @MacroOps
Recently, the job openings hit a record in the US after increasing the most in a 3 month period ever. The trends in America aren’t as severe as Japan as a general rule. One issue in Japan is workers stay with companies for 12 years which is more than the 4.2 year average in America. Job switchers have higher wage growth. America is going down a path of losing dynamism as fewer millennials are starting businesses and moving across state lines. Change in the labor market, which is synonymous with risk taking, helps grow the economy. It also helps boost productivity. Japan has seen a 10% decline in the productivity of workers in the service sector from 2003 to 2016 which is 70% of the economy. That explains why corporations aren’t increasing the share of profits that go to labor.
Monetary Policy
The change in the labor market dynamic, which implies wage growth won’t accelerate as the unemployment rate falls, means a new monetary policy is in order. There’s less of a need for rate hikes if wage growth isn’t going to drive inflation. A low unemployment rate and low inflation rate means the Fed has satisfied both its mandates. The Fed doesn’t seem to see this possibility as it is raising rates faster than the other major global central banks. It is becoming hawkish even as the core PCE inflation is below its target. In fact, the Fed’s rhetoric has been the most hawkish since 2006 as we detailed previously.
The Fed anticipates inflation which may not be coming. That would mean it is too hawkish and can cause a recession for no reason. It will be interesting to see what can cause a recession without heightened inflation or a hawkish central bank. This isn’t, of course, nirvana because growth is decelerating. The game plan of central bankers appears to buy assets to push up growth. Japan’s accelerated balance sheet expansion started in April 2013. In 2013, Japan’s GDP per capita was $40,490; it was $38,440 as of 2017 which implies this QE program has failed.
Conclusion
The US labor market might not produce great wage growth this cycle just like Japan. Governments and central banks don’t have clear answers on how to create growth in this moribund scenario where there’s an elongated period of low growth, but no recession.
Have comments? Join the conversation on Twitter.
Disclaimer: The content on this site is for general informational and entertainment purposes only and should not be construed as financial advice. You agree that any decision you make will be based upon an independent investigation by a certified professional. Please read full disclaimer and privacy policy before reading any of our content.


