UPFINA's Mission: The pursuit of truth in finance and economics to form an unbiased view of current events in order to understand human action, its causes and effects. Read about us and our mission here.
Reading Time: 5 minutes
Before we get into the details of this article which will be on the consumer credit market, it’s important to review the valuation of the stock market because the more expensive it gets, the riskier it becomes. If default rates were rising and the stock market was cheap based on normalized earnings using the average historical margins, it wouldn’t be cause for concern. It’s weird to think of that possibility now because most investors associate a recession with a collapsing stock market like what happened in the early 2000s and 2008. The recession in the early 2000s wasn’t traumatic by most historical measures, but stocks fell sharply because they reached the most expensive valuations ever. Unfortunately, due to central bank interventionism in the form of quantitative easing, we are once again in an expensive market where a recession could cause crashing stock prices. The Shiller PE is at 30.60 as of September 2017 which is nearly double the median of 16.12 and average of 16.76.
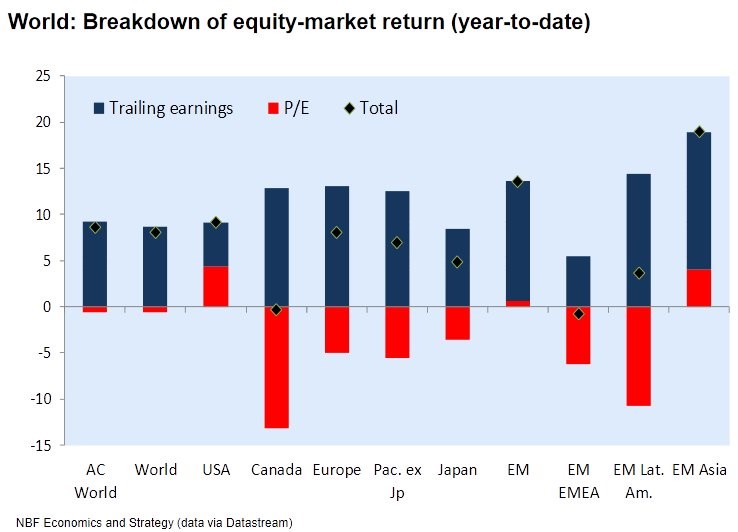
The chart below is one differentiated example of how expensive stocks have gotten this year. It shows a breakdown of various markets’ performance across the globe.
Changes In Earnings And Multiples
The black dot is the performance year to date. The blue and red bars combined get you there. The red bar is multiple expansion/contraction meaning when investors pay more/less for the same earnings. The blue bar is earnings growth/declines which is when firms earn more/less profits than the prior period. The chart shows that multiple expansions in the US were the largest this year out of every area in the world. That’s a dangerous trend which likely won’t continue as investors find value internationally.
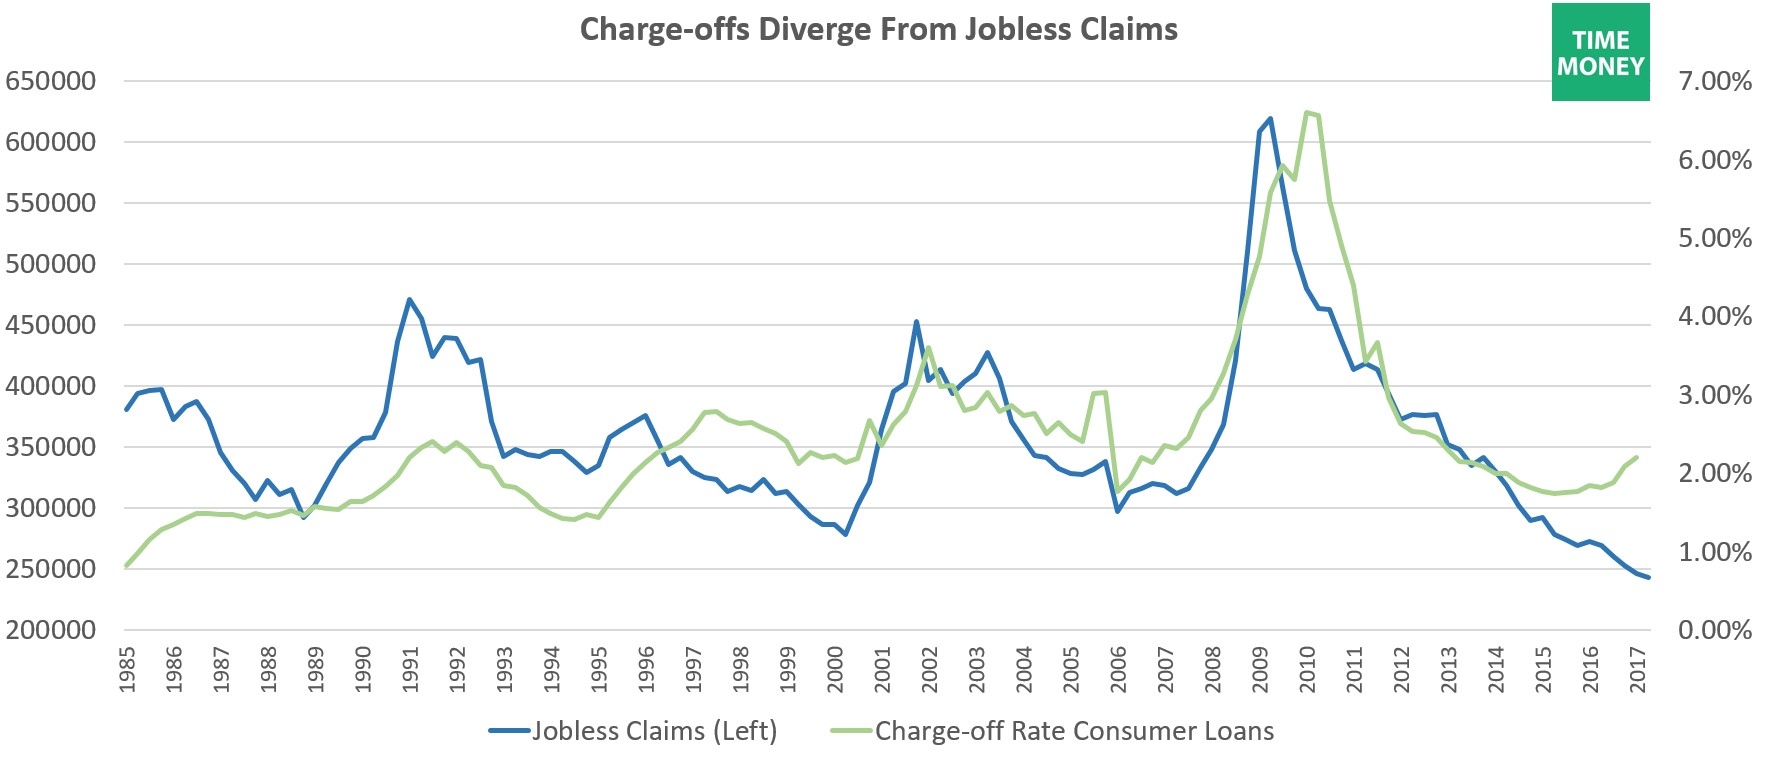
Moving on to the consumer credit side to get a better understanding of the timing of the credit cycle, the chart below shows the relationship between jobless claims and consumer loan charge-offs.
Consumer Charge-offs Versus Jobless Claims
Charge-offs are the declaration by a creditor that a loan is likely not to be paid. When the charge-offs go up, it’s a signal the borrowers are stressed. It makes sense that jobless claims and charge-offs are related because the consumer is more likely to default on loans if job losses are happening in the economy. This cycle, the charge-offs are leading the jobless claims. Keep in mind, the latest charge-off figures are from Q1 and the jobless claims numbers are from Q2 as they are updated every week. Even with delayed data, charge-offs are leading. This shows that the business cycle might be coming close to rolling over. The key will be seeing a confirmation of that in the labor market. Both the charge-offs and the jobless claims got very low this cycle so when they start moving higher, like charge-offs are doing, it might seem like nothing, but it’s worth following. Traditionally the 300,000 mark is considered to be pivotal for jobless claims, but it’s better to lower that mark because by the time it gets to 300,000 the economy might already be in a recession.
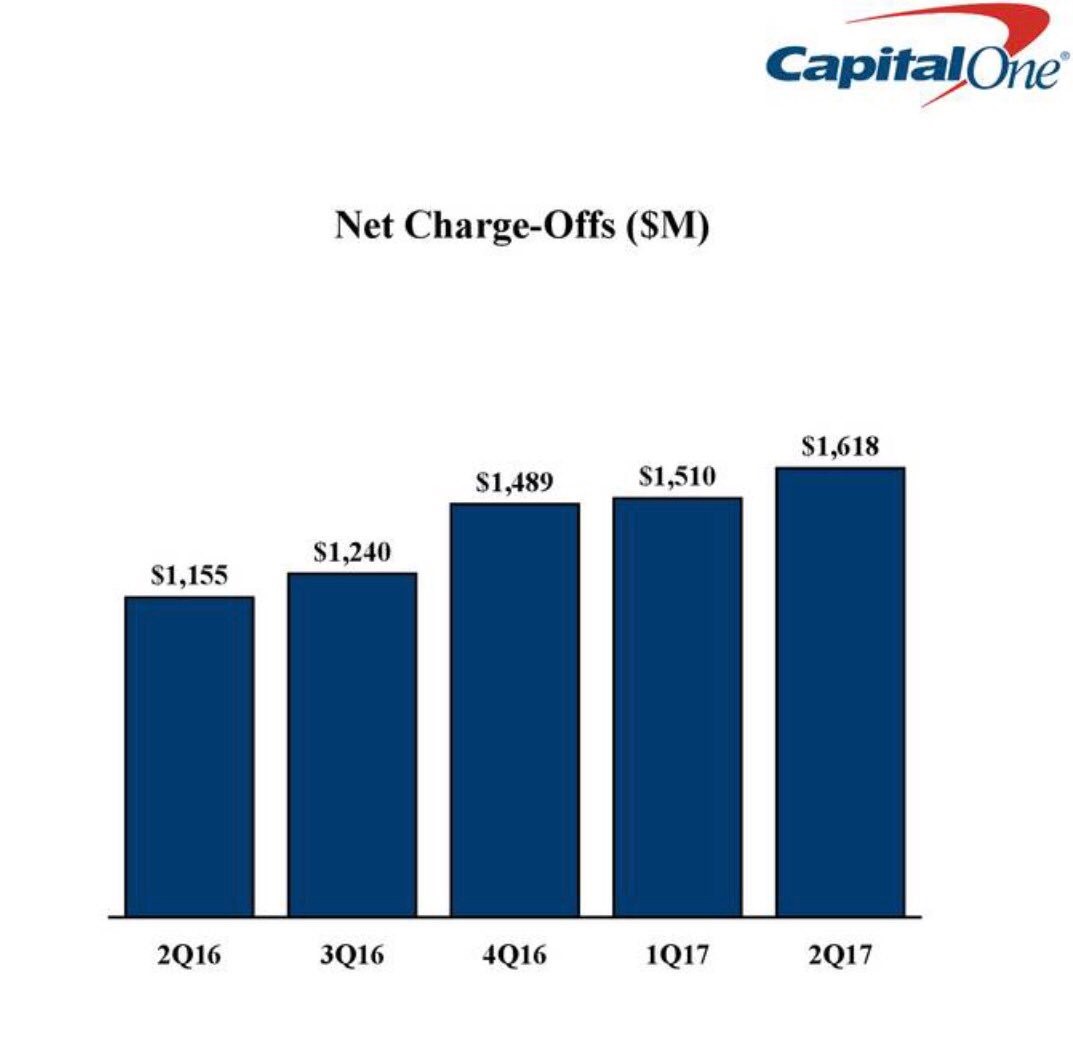
Let’s look at two example of consumer credit firms to get a detailed picture of what is going on in the market. This will show us results from Q2 which will help us figure out what will occur in the next economy-wide report. The chart below shows the net charge-offs from Capital One. They are increasing, which is a bad sign.
Capital One Net Charge-offs
The domestic credit card charge-off rate is 5.11% which is down 3 basis points from last quarter, but is up 104 basis points from Q2 2016. Comparing the numbers to last year’s data is better because it corrects for seasonality. Clearly Capital One is underperforming the overall market and signals potential deterioration in the consumer credit market. The auto loan charge-offs were up 6 basis points sequentially and 50 basis points from last year. The auto loan bubble is $1.2 trillion. It along with student loans can cause credit card default rates to spike as the consumer’s balance sheet is weak and it runs out of cash despite a strong labor market. Current jobless claims are 233,000. Comparing this cycle to the last one, the charge-off rate on U.S. Capital One cards was 4.31% when jobless claims were 360,000 in Q4 2007. Jobless claims were higher and charge-offs were lower. This indicates that the jobless claims data might be a false flag making the economy look better than it is.
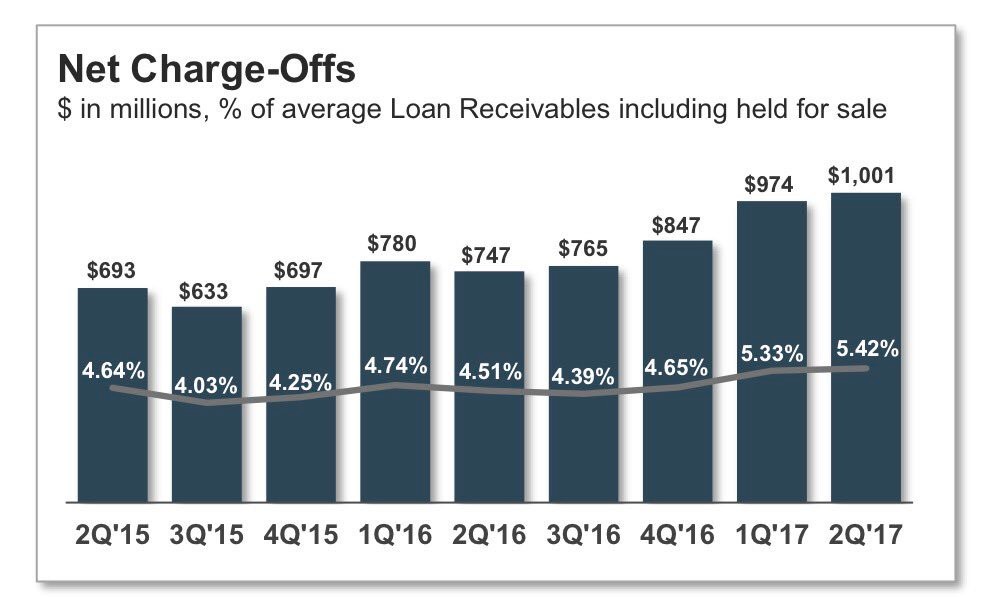
The chart below is from Synchrony Financial which is another consumer credit firm.
Synchrony Financial Charge-offs
Just like Capital one, charge-offs are increasing. Loan receivables are loans to the bank that are counted as assets on the balance sheet. The line in the chart shows the percentage of loans which the bank is counting as charge-offs because they are unlikely to be paid. The point of this line is to adjust the increases in charge-offs for the amount of loans given out. The increasing line shows that charge-offs are increasing adjusted for lending increases. The percentage of loans which are 30-days past due are flat sequentially and up 46 basis points year over year. The percentage of loans 90-days past due are down 16 points sequentially and up 23 basis points year over year. Clearly, Synchrony Financial is having the same problems Capital One is having.
Finally, let’s look at the retail unsecured debt market to see a potential catalyst for weakness in the corporate debt market. Retail has been decimated by Amazon and Wal-Mart as their economies of scale allow them to offer the lowest prices. The chart below shows the recovery rates of unsecured retail debt compared to the whole market.
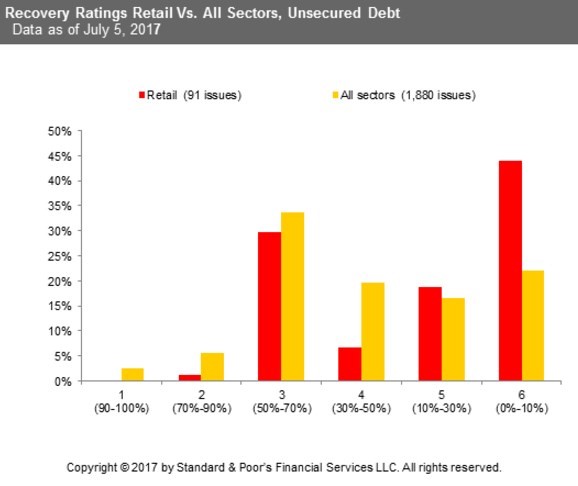
Retail Has Low Recovery Rates
The recovery rates are lower. A recovery rate is the amount of capital a lender receives after the borrower defaults. The reason for these low recovery rates is that retailers are asset light. This makes borrowers dependent on cash flows. When the firm is defaulting, the cash flows run dry and there’s not much for the lender to seize. Recoveries are 50% lower than average. That will put a dent in the market when these firms default. 18% of retailers have a CCC rating or lower which is about double last year, meaning trouble is brewing.
Conclusion
The stock market is following the labor market so it is moving higher. However, the labor market might be a false flag because the consumer credit market is showing increases in defaults. Even though the corporate bond market is strong, retailers are threatening it with their low recovery rates. These are the negative catalysts which might force the stock market’s expensive valuation lower.
Have comments? Join the conversation on Twitter.
Disclaimer: The content on this site is for general informational and entertainment purposes only and should not be construed as financial advice. You agree that any decision you make will be based upon an independent investigation by a certified professional. Please read full disclaimer and privacy policy before reading any of our content.


