UPFINA's Mission: The pursuit of truth in finance and economics to form an unbiased view of current events in order to understand human action, its causes and effects. Read about us and our mission here.
Reading Time: 5 minutes
Q2 GDP growth was revised higher from 4.1% to 4.2% even though the estimate for real consumption growth was revised lower from 4% to 3.8%. That being said, the consumer had a strong rebound from Q1 and still drove GDP growth to an amazing result. The obvious question is whether this growth rate will continue. The first official data which tells us if the economy remained on the right track is the July Personal Income and Outlays report which gives us information on real income, real consumption, and inflation.
Real Income Growth Is Strong
The results from this report were largely in line with estimates which is great news because personal income and consumption growth were steady while inflation remained low. This is an extension of the Goldilocks economy which has been in place since late 2016 which has allowed U.S. equities to rally higher. Month over month real disposable personal income growth was 0.3% which met estimates and was down 0.1% from June. On a year over year basis, growth fell about 7.5 basis points to 2.9%.
Real disposable personal income growth is clearly calculated differently from real wage growth since real wage growth is negative. One main difference is real wage growth is commonly deflated by CPI which is higher than PCE. Income also isn’t the same as wages. Wages is pay from a job, while income can be earnings from anything such as proprietor income and personal interest income. It’s debatable which measurement is more important. It certainly looks like real income growth is more relevant in the current economy because the Conference Board consumer confidence report showed consumers are the most confident since 2000. That’s consistent with stable real income growth and inconsistent with negative real wage growth.
The chart below shows 5 year annualized real personal income growth net of government transfer receipts.
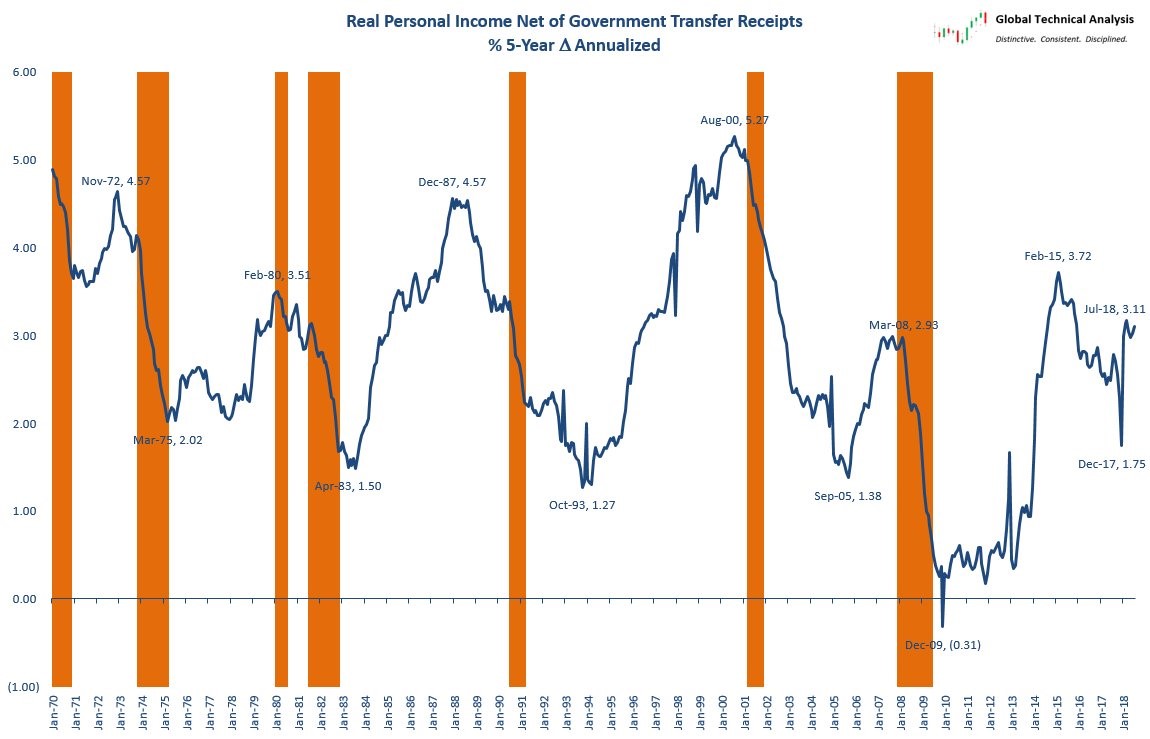
This growth rate in July was 3.11% which is one of the highest growth rates this cycle. This chart shows recessions usually occur when growth decelerates. The economy is nowhere near that as growth is accelerating.
Strong Real Consumption Growth
Real consumer spending growth was 0.4% month over month which met estimates and was the same as last month. On a year over year basis, it was up from 2.7% growth to 2.8% growth. This is a continuation of the positive spending growth trend we have witnessed in the past few years. This goes along with the extremely positive results from the Conference Board survey which is a month ahead of this report. It appears Q3 GDP growth is on track for another strong growth rate.
Inflation Remains Low
Inflation is the most important metric to follow because the economy is near the end of the cycle which is when inflation tends to increase. The core PCE inflation measurement is the Fed’s favorite inflation stat. This is the metric which needs to hit the Fed’s 2% target. Headline PCE was up 0.1% month over month which missed estimates for 0.2% and was the same as June. Headline PCE inflation was up 2.3% year over year which met estimates and was 0.1% higher than last month.
Core PCE was up 0.2% month over month which met estimates and was 0.1% higher than June. Finally, core PCE was up 2% year over year which met estimates and was about 0.1% higher than June. That’s the highest year over year core PCE since April 2012. April 2012 was the last time inflation hit the Fed’s goal. Even though year over year inflation went up from 1.92% in June to 1.98% in July, the 2 year growth stack was lower because June 2017 core PCE was up 1.62% and July 2017 core PCE was up 1.5%. The easiest comparison will be in August as August 2017 had core PCE growth of only 1.41%.
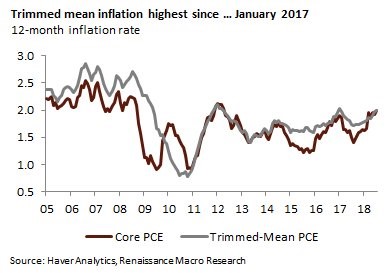
The chart above supports the notion that inflation isn’t as high as it seems. While core inflation is the highest since 2012, the trimmed mean inflation rate is only the highest since January 2017. To be clear, the trimmed mean PCE inflation rate removes the highest and lowest parts of the inflation calculation. It is done by the Dallas Fed.
Contributing Factors To Inflation
The Fed’s 2% core PCE inflation target was met. Let’s review the factors which led to this result. As you can see from the chart below, housing services and core goods excluding pharmaceuticals both were above their contribution targets.
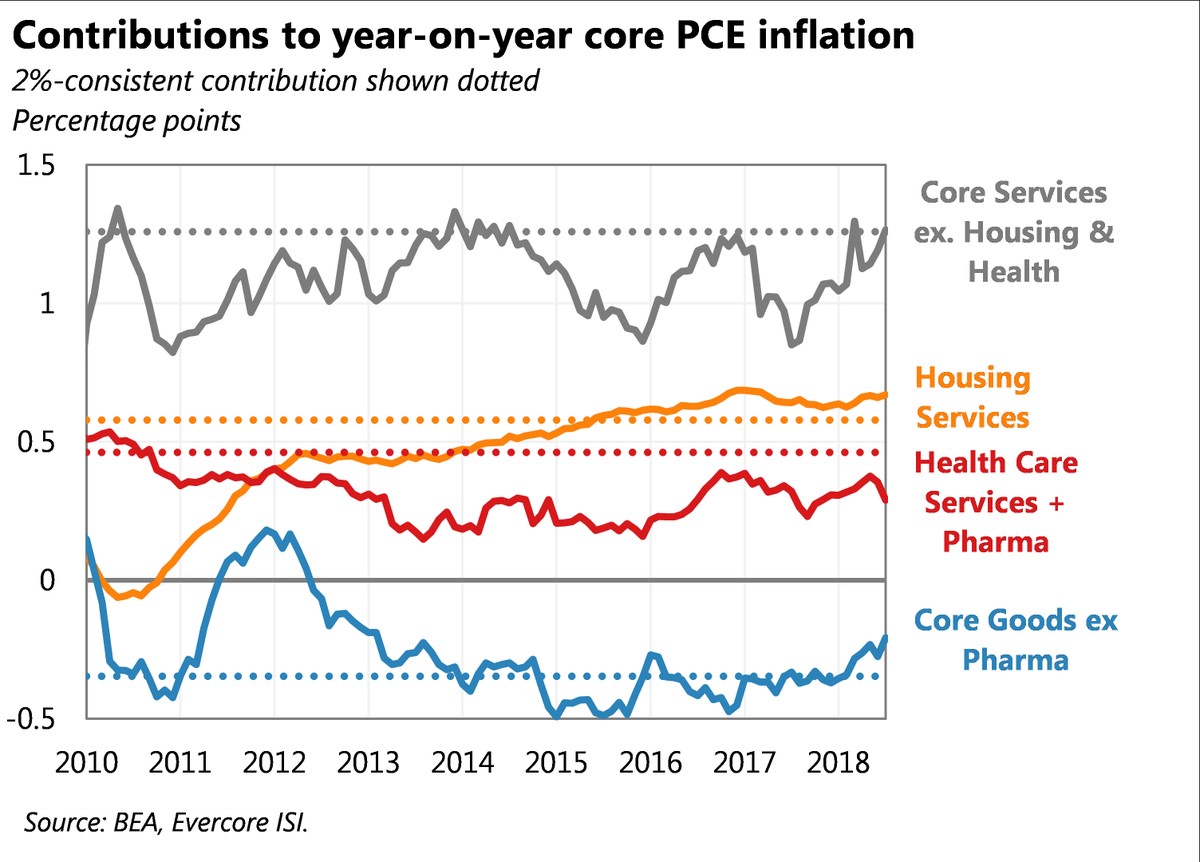
Core services excluding housing and healthcare recently increased. Only healthcare services and pharmaceuticals saw its inflation rate decline.
How Should We Measure Inflation?
It’s always a heated debate over how the Fed should measure inflation. We look at what the Fed looks at, but it’s also worth noting other arguments. Some say the Fed should review non-discretionary inflation closer than discretionary inflation since the Fed shouldn’t want food and shelter to become unaffordable. The chart below shows non-discretionary inflation is above the Fed’s 2% target.
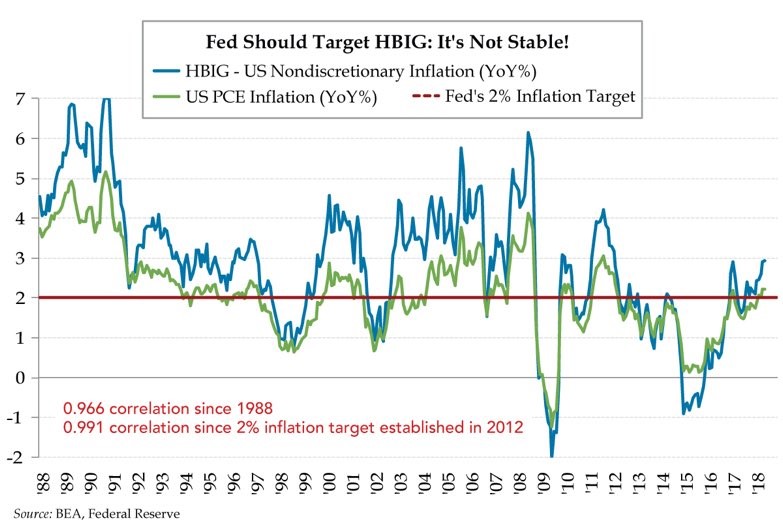
That’s not a shocker because the positive difference between non-discretionary and discretionary inflation is driven by oil prices. PCE inflation is usually the lowest calculation of inflation, so there are a lot of stats which encourage the Fed to be more hawkish.
Real Rates About To Be Positive
Deflating by core PCE, the Fed is about to reach positive real rates for the first time since 2008 in September. The September rate hike is almost a guarantee as the futures market sees a 98.4% chance of a hike. This chart makes it look like the Fed is not even close to finishing its hike cycle since real rates were above 3% in the last cycle.
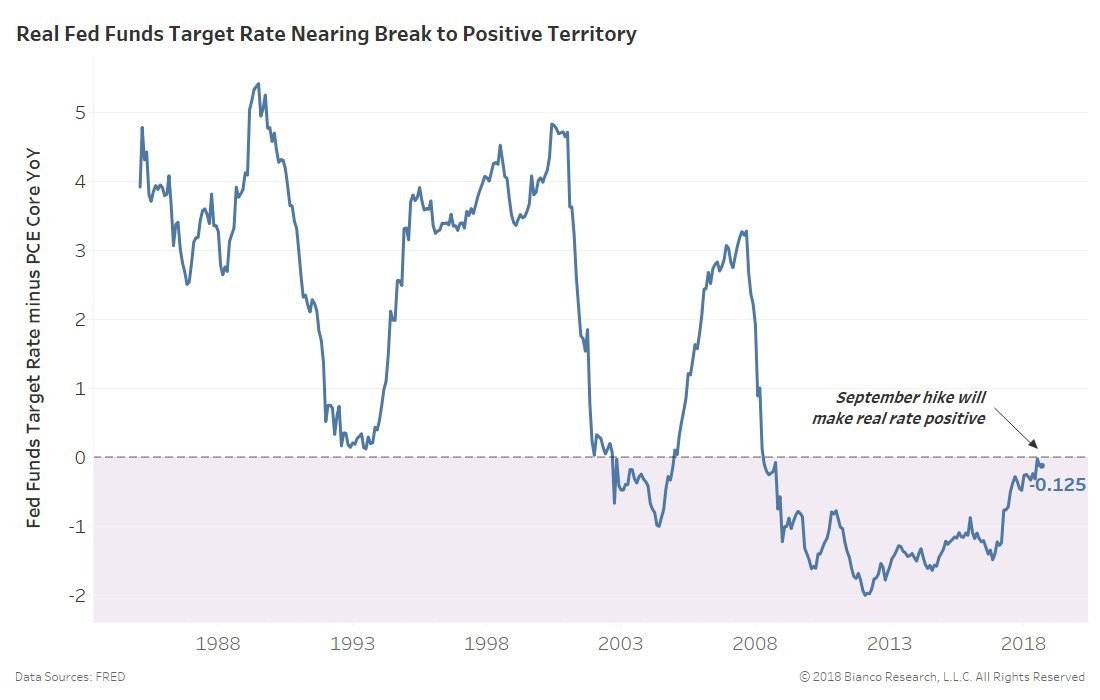
Real rates differ from the yield curve which is nearing an inversion. An inversion indicates the Fed is close to done with its hike cycle. We will see which indicator is right this cycle.
Conclusion
The Fed is presiding over a pristine economy with positive real income growth and real consumption growth. Inflation isn’t that strong when reviewing the 2 year stack. In response to this Goldilocks scenario, the Fed is raising rates at a quicker pace as there is a 72% chance of at least 4 rate hikes in 2018. The hike cycle is likely near its close even though real rates are only just about to go positive for the first time in this expansion. Given the weak GDP and inflation during this cycle, it wouldn’t be unusual for real rates to be reaching a high for this cycle.
Have comments? Join the conversation on Twitter.
Disclaimer: The content on this site is for general informational and entertainment purposes only and should not be construed as financial advice. You agree that any decision you make will be based upon an independent investigation by a certified professional. Please read full disclaimer and privacy policy before reading any of our content.


