UPFINA's Mission: The pursuit of truth in finance and economics to form an unbiased view of current events in order to understand human action, its causes and effects. Read about us and our mission here.
Reading Time: 5 minutes
The latest economic recovery hasn’t been as strong as previous ones because of deceleration in productivity and the labor force population growth. This is why some of the economic indicators which had worked in the past haven’t done well in this cycle. You can argue that looking at consistently positive indicators because ‘this time is different’ is a biased approach, but this business cycle is different from the others as each one is unique. It doesn’t make sense to look at an indicator which has flashed recession many times this cycle and decide the next time it indicates a recession is coming, it will be accurate. That would be the definition of insanity: doing the same thing and expecting different results. This doesn’t mean to ignore valuation metrics which show the market is expensive (Stock Valuations Are In The 99th Percentile) while return on equity hits record lows. Valuation metrics have historically been terrible at predicting intermediate term (less than 2 years) returns and great at predicting short-term returns. If valuations could predict long-run returns, they would never get to extreme levels since high valuations imply negative returns.
The chart below shows an indicator which hasn’t yet predicted a recession, but is headed in that direction over the next few quarters. It shows the 10-year breakeven inflation minus the Fed funds rate.
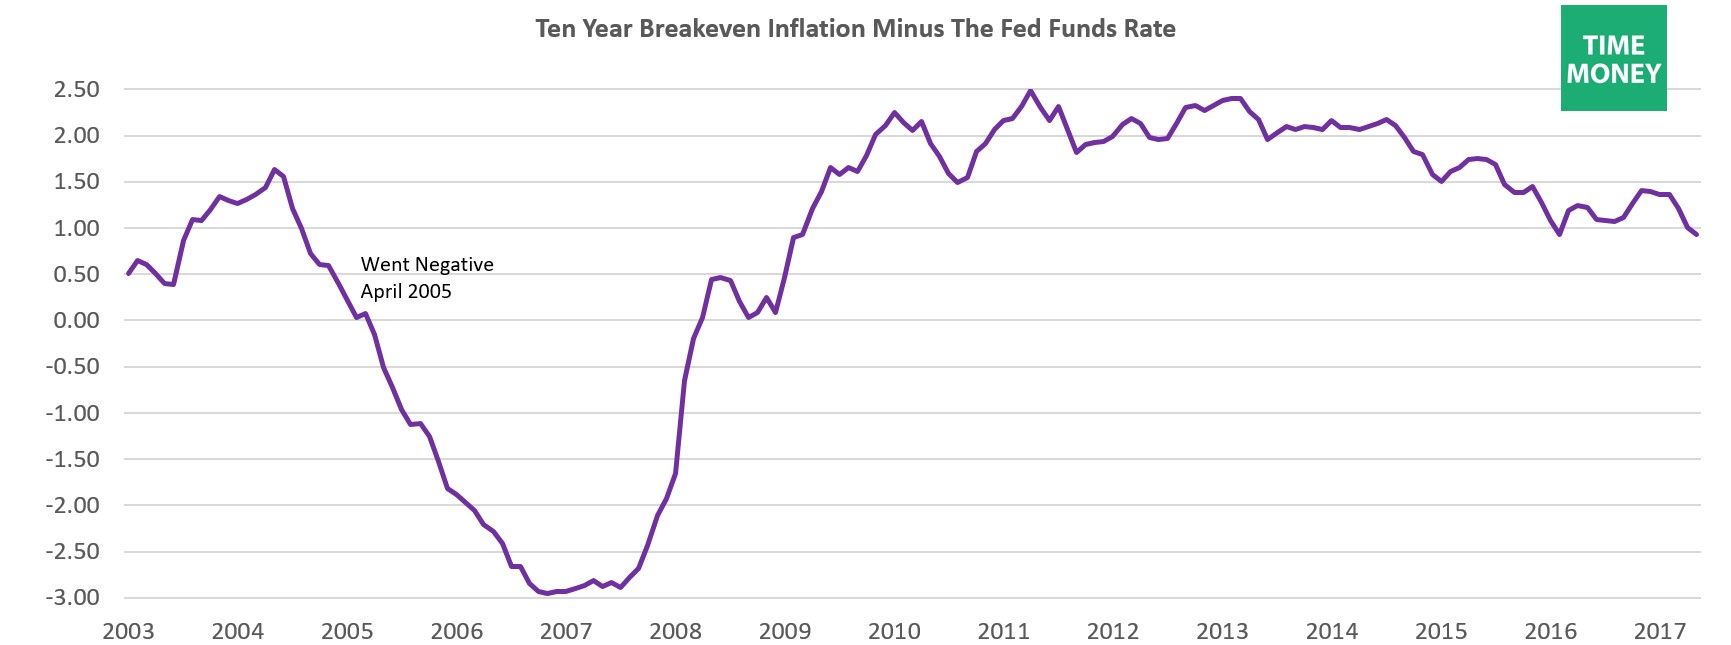
Ten Year Inflation Minus Fed Funds Rate Isn’t Signaling A Recession
Breakeven inflation is the market based valuation of inflation opposed to the Consumer Price Index which is calculated by economists. The market based valuation of inflation takes the inflation linked bond yield known as TIPS (treasury inflation protected securities) and subtracts the nominal bond yields. Since TIPS adds inflation, the difference is the implied inflation rate.
The Federal funds rate is the near-term interest rate the Federal Reserve sets with the goal of price stability and low unemployment. Normally, the Fed raises rates when inflation increases to prevent it from getting higher. Lately, the Fed has been raising rates despite the inflation rate declining. The Fed keeps citing wage inflation growth which is supposedly coming, but no results are backing up this claim. When the Fed gets hawkish and raises rates, it tightens credit conditions and leads to recessions. As you can see, the difference between 10-year breakeven inflation and the Fed funds rate went negative in April 2005 which was 2 years and 8 months prior to the start of the recession. That would imply a recession is far away because the difference is positive for now. According to Fed President Bill Dudley, the Fed will raise rates 1 more time this year and 3 more times in the following 2 years. With the difference currently at 0.93, those 4 hikes would make the difference negative. Another way would be less interest rates and more disinflation.
As you can see from the chart below, the 5-year breakeven inflation rate has been moving in the opposite direction the Fed has expected as it has fallen from 2.23% to 1.78% recently. If the 10-year breakeven inflation rate fell to the 2016 lows, the Fed would only need 2 more rate hikes to make the difference negative.
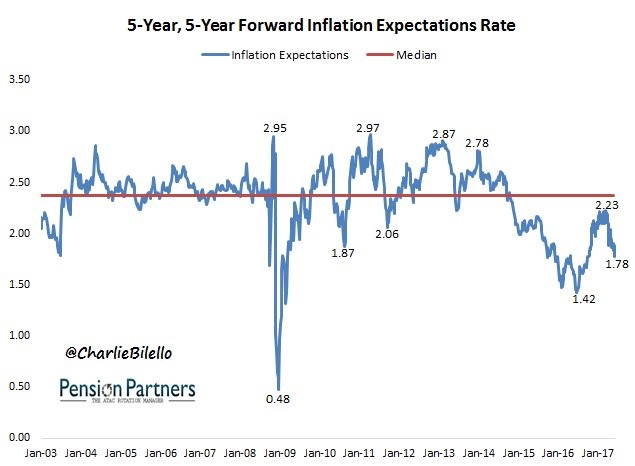
5 Year Breakeven Inflation Shows Declines Since The Beginning Of The Year
Janet Yellen blamed the latest disinflation seen this year on declines in drug prices and telecommunications. Those prices have come down, but so have commodity prices. Before we get into the drop in commodity prices, let’s acknowledge how ridiculous it is that the Fed is disappointed that the cost of your drugs and smartphone contract have gone down, so the Fed couldn’t meet its prized 2% inflation target.
Competition and innovation causes price deflation as evidenced by the price of computers. In a free market prices decline and quality improves. The Fed is afraid of deflation because of two reasons. First, the Fed is stuck at the zero bound when it comes to interest rates (although other central banks have recently gone negative). Second, the debt would become tougher to pay off in a deflationary environment.
The chart below shows the Thompson Reuters/Core Commodity CRB index. This chart tracks the chart above as commodities have driven disinflation since wage growth has been solid, but stagnant.
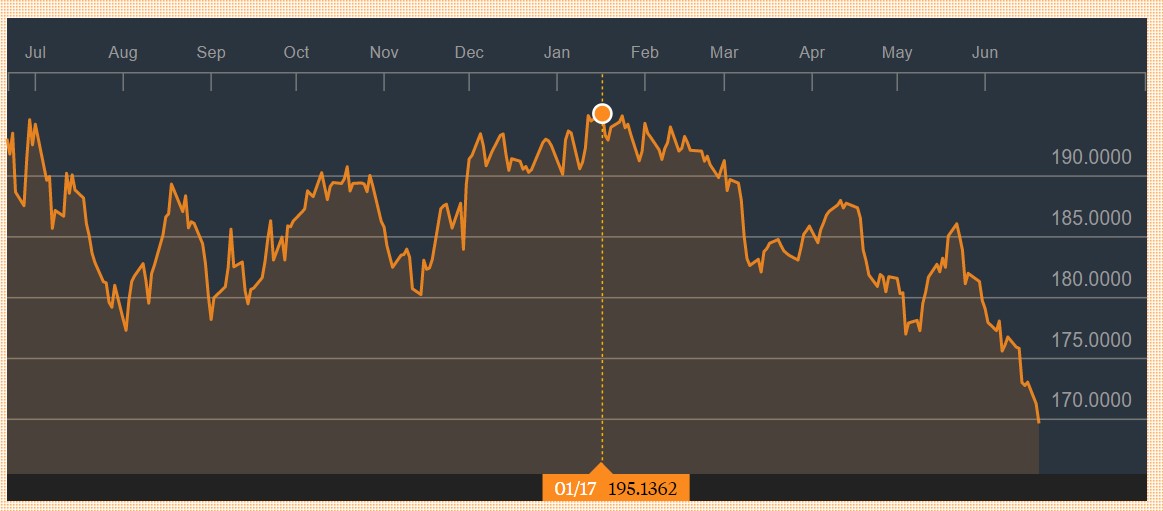
Commodity Prices Have Been Declining Since January
As you can see, the price of the index is down 11.87% year to date. It’s down even more from the high on January 17th. Janet Yellen picked out two categories which are seeing collapsing prices, but she ignored the elephant in the room. While drug prices and telecommunications prices may move higher after this dip like she suggests, there would need to be a drastic economic change for commodities to reverse their downtrend. Oil is leading the decline as it’s at its 9-month low. The OPEC cuts aren’t working as production was up 336,000 barrels per day in May because the nations not included in the cuts, namely Iraq, Libya, and Nigeria are increasing production.
The first chart in this article looked at the Fed funds rate, but that might not be the best rate to review as it ignores quantitative easing. The chart below looks at the Krippner Shadow Fed Funds Rate which considers QE.
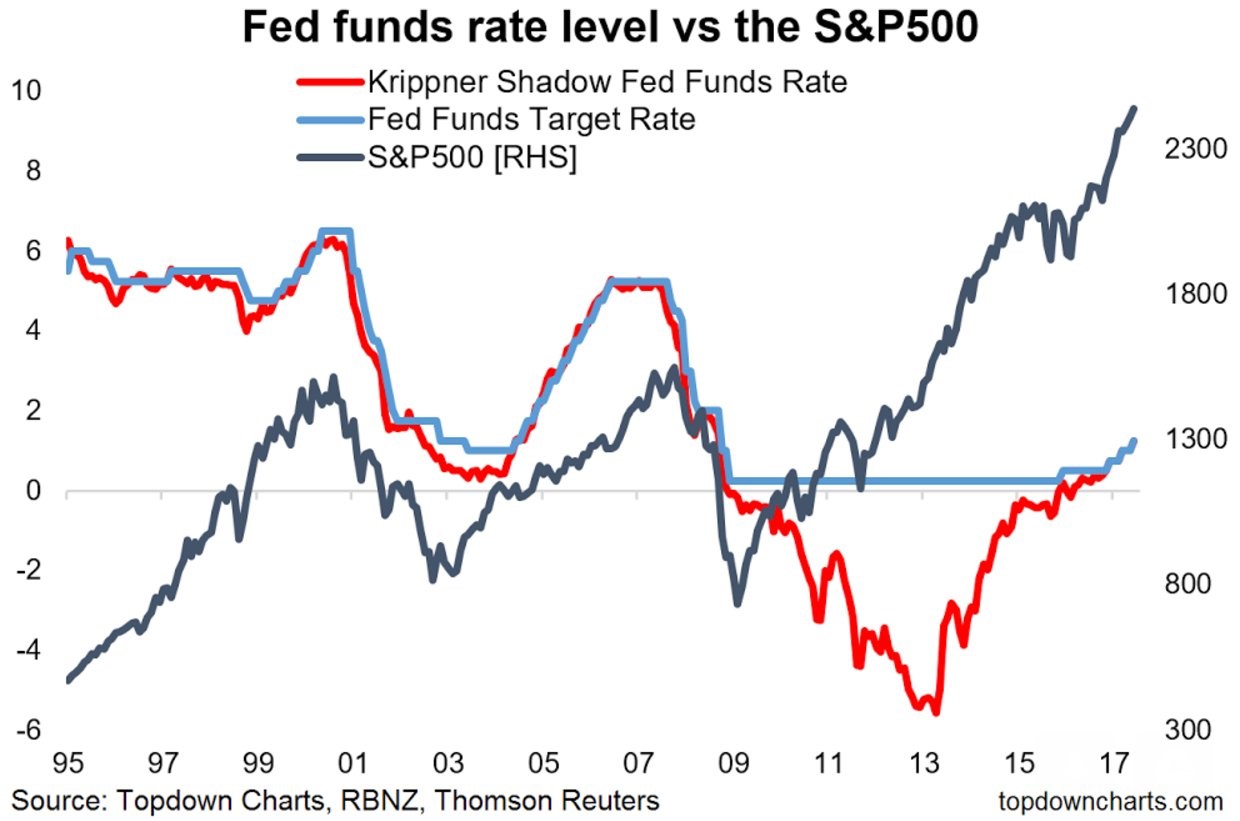
Krippner Shadow Fed Funds Rate Shows 650 Basis Points Of Tightening
As you can see, the Krippner Shadow Fed Funds Rate went negative in 2009 and stayed negative until 2016. This rate cut cycle was much bigger than the previous one and it led to a bigger stock market rally. In the past 5 rate hike cycles, the Fed has raised rates an average of 270 basis points. If you just look at the regular Fed funds rate, the Fed expects to raise rates 200 basis points in total if you include Dudley’s guidance. However, if you use the Shadow rate, the Fed has already raised rates 650 basis points. With the Fed having guidance for unwinding its balance sheet and raising rates further, this tightening cycle can get even larger. The largest tightening of the past 5 cycles was 425 basis points which led to the financial crisis of 2008.
Conclusion
Your level of concern about the economy depends on how you analyze the effect of quantitative easing. If you assume it had a large effect on the credit market, given the current rising fed funds rate, then you’d expect a recession in the next few years because the breakeven inflation minus the Fed funds rate is still 0.93. Using the shadow Fed funds rate makes the situation look dicier because the Fed has already tightened rates the most out of the past 5 cycles and it hasn’t even started with the unwind of the balance sheet, which increases the possibility of a recession occurring much sooner.
Have comments? Join the conversation on Twitter.
Disclaimer: The content on this site is for general informational and entertainment purposes only and should not be construed as financial advice. You agree that any decision you make will be based upon an independent investigation by a certified professional. Please read full disclaimer and privacy policy before reading any of our content.


