UPFINA's Mission: The pursuit of truth in finance and economics to form an unbiased view of current events in order to understand human action, its causes and effects. Read about us and our mission here.
Reading Time: 6 minutes
We’ve previously discussed the expansion of stock buybacks in a few articles, notably: Are Stock Buybacks Good Or Bad?, Do Stock Buybacks Deserve The Blame For Everything? and Stock Buybacks Harm US Competitiveness. The capital returned to shareholders has been elevated during this market cycle. This trend has caused some economists and investors to grow worried about the capital invested into new initiatives considering the slow productivity growth in this cycle. The chart below shows the secular downtrend in factor productivity, real GDP per labor force participant, and capacity to utilization.
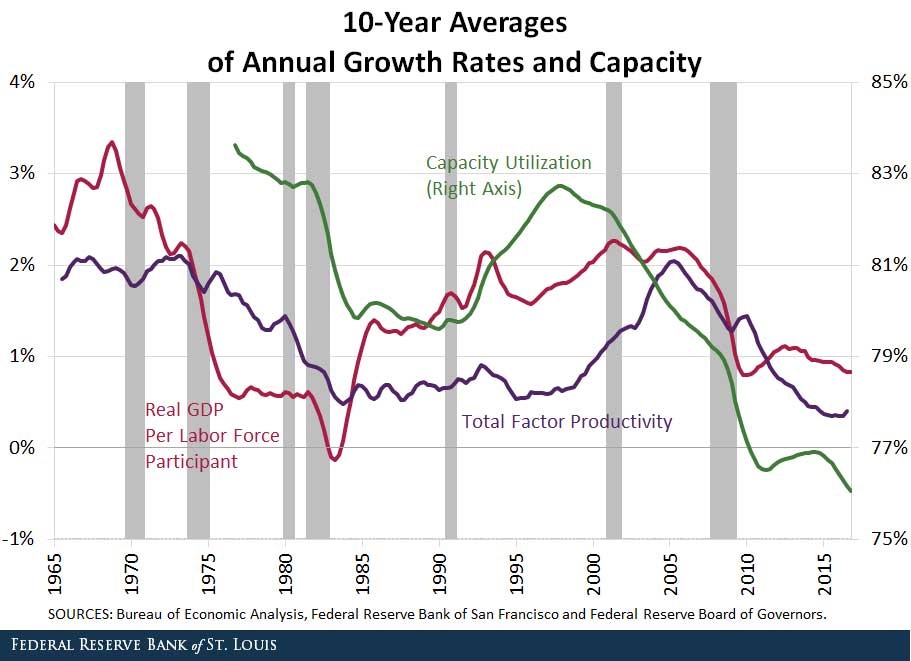
This Cycle Has Seen Slowing Productivity Growth
The real GDP per labor force participant goes further than the adjustment per capita, by adjusting for the decline in the workforce participation rate. Even with that adjustment, the metric still looks weak.
Capital Returned To Shareholders Is Elevated
There’s no need for the government to force corporations to invest in new initiatives. The management teams would do so if it made sense. The key is to have an economy which provides opportunities for businesses to expand. This can occur through regulatory cuts and a strong economy that has a lot of demand. The chart below shows this trend of a shrinking percentage of capital invested for growth and a higher percentage of money returned to shareholders.
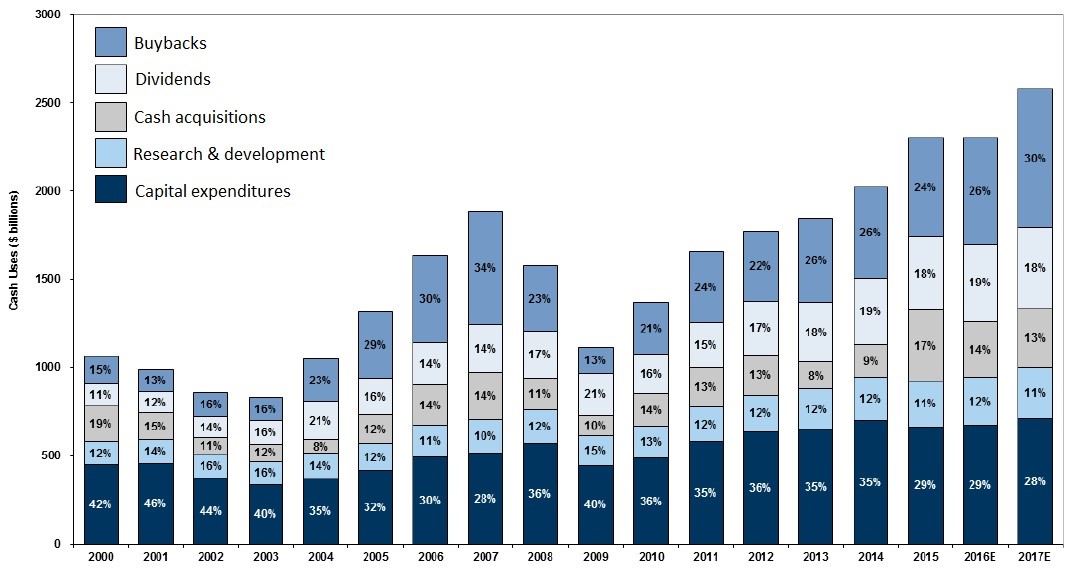
Firms Returning More Money To Shareholders This Cycle
The capex, research and development, and cash acquisitions count as investing for growth. Buybacks and dividends count as capital returned to investors. When reading this chart make sure to realize that although the bars are getting bigger, the percentages for invested capital are shrinking. In 2000, 74% of capital was put towards investing for growth and 26% was returned to shareholders. In 2017, it’s estimated that 58% will be invested for growth and 42% will be returned to shareholders.
Corporations Dominate Small Business
The other side of S&P 500 firms returning more money to shareholders is that they have excess profits because they are taking share from small business. There are less public companies then in the past few expansions. The chart below shows the dominance of the top corporations.
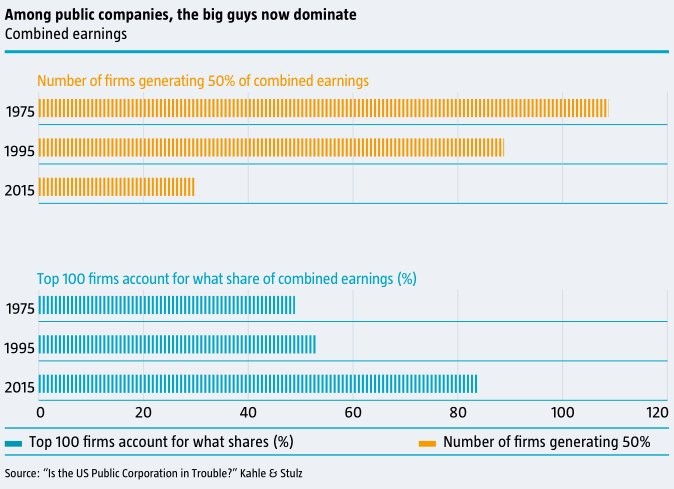
Large Firms Take Share
The number of firms generating 50% of corporate earnings has fallen from about 110 in 1975 to about 30 in 2015. The percentage of earnings the top 100 firms generate has increased from about 50% to over 80%. This is similar to the inequality charts which show the rich gaining a larger percentage of the wealth. In this case, large companies are dominating because of several factors, such as increased regulations and compliance costs for small companies, buying out small businesses using cheap credit, which at the same time innovates large companies, giving them a greater competitive advantage.
Capex Spending Set To Increase
The reason we’re discussing the low percentage of capex spending in the past few years is to set up the point that recent surveys show capex spending will increase. As you can see from the chart below, the average of the 5 regional Fed surveys shows planned capex growth is higher than at any point in the past 17 years.
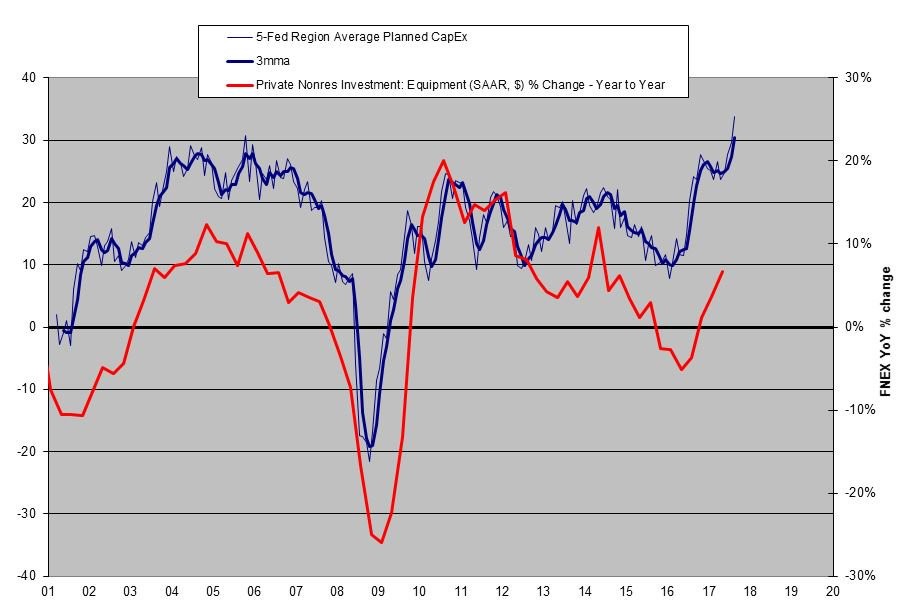
Fed Surveys Show Capex To Increase in 2018
Sometimes the private non-residential investment growth in equipment isn’t completely correlated to the survey’s findings, so it will be interesting to follow capex spending in the next 6 months. As you can see, from the chart below, in late 2017, the gap between analysts’ S&P 500 projected capex and the actual S&P 500 monthly capex was high. The last time that happened in 2013 an increase in actual capex occurred in the following years.
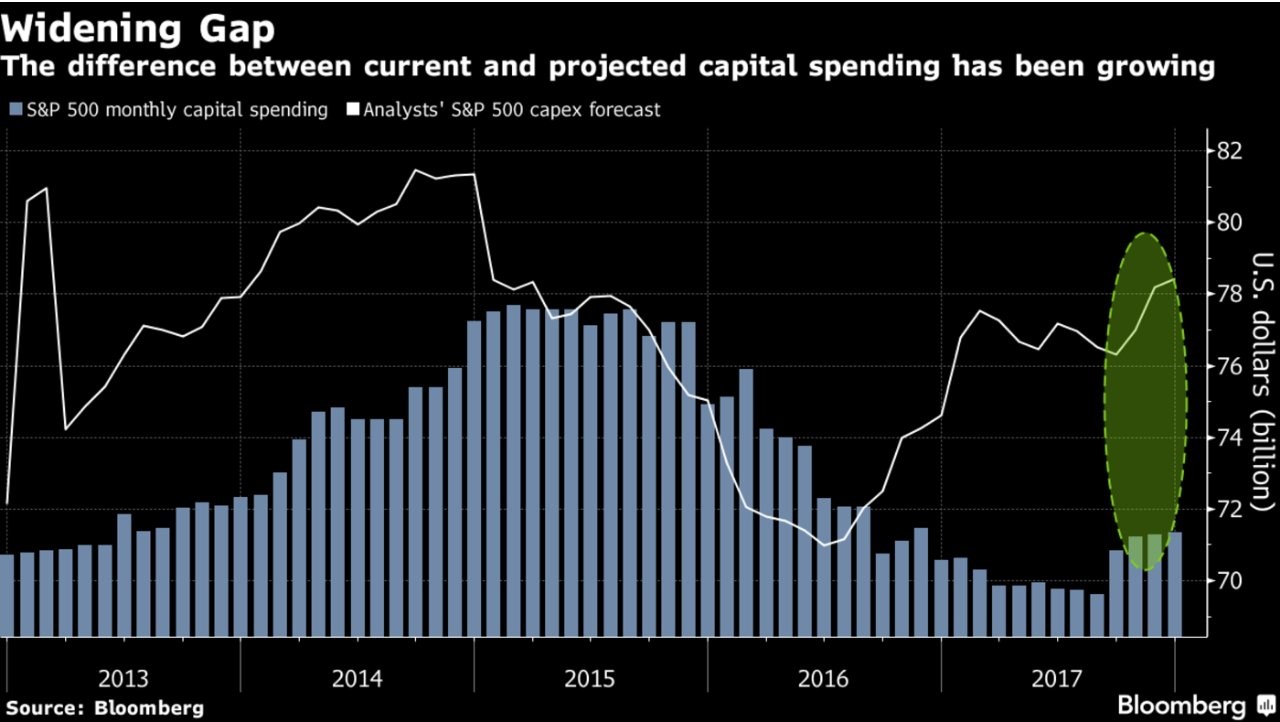
Analysts Expect Huge Capex Growth. Firms Aren’t There Yet
Another point worth noting is the year over year growth following recessions is boosted by base effects. Don’t be confused by some of the high growth numbers. The first chart in this article shows how the percentage allocated towards capex has been falling.
An improvement in capex could help productivity growth, lack of which has been the primary factor for lagging wage growth. Keep in mind that the nirvana for policy makers is improving productivity growth, while the worst possible thing is commodity inflation. Productivity growth is great because it allows workers to get a raise without forcing companies to increase prices. Their improvement in efficiency allows them to get paid more. That’s how we will see the difficult to achieve real wage growth for non-supervisory workers. On the other hand, commodity price inflation causes the Fed to hike rates before real wage growth can be achieved. This is the most hotly debated subject in monetary policy. Low rates are fine when inflation is low, but when inflation picks up, it can hurt real wages more than low nominal wage increases can. Low rates don’t necessarily create real wage growth as we’ve seen this cycle, but tight financial conditions can certainly hurt them.
What Is Driving Capex Growth?
The obvious follow up question when seeing the capex chart move to the upper right, is “what is the catalyst of this change?” There are a few we can think of. The first is the cyclical improvement in global growth. Another catalyst is President Trump’s effort to lower the burden of regulations. We’re far from a website trying to support a particular politician or political party. Objectively, Trump has done a relatively good job at limiting regulatory restrictions, when compared to past administrations’ first year in office. As you can see, the chart below shows the increase in the number of regulatory restrictions in each of the past few presidents’ first year in office.
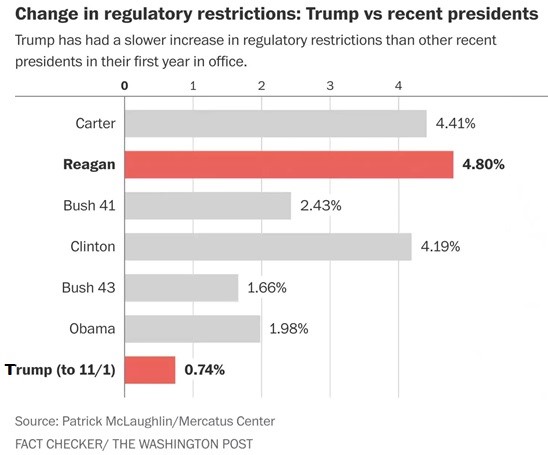
Trump The Deregulator
Trump has seen a 0.74% increase in regulations. Trump’s attempt to roll back regulations increases the opportunities businesses have to invest in new initiatives, if subsequent years resemble the first year in office. It also doesn’t hurt that corporations will be getting a tax cut as a result of the GOP tax plan which lowers the statutory corporate tax rate from 35% to 21%. It could however be argued that the disparity between small business (sole proprietors, LLCs, etc) and corporations (inc, corp) will increase, more favorably for corporations, since it appears that most small businesses will only see a marginal benefit from the proposed 20% deduction, which is subject to significant limitations. In fact, the removal of the SALT deduction could likely increase the tax liability of most small businesses even with the 20% deduction. A benefit for capex however, is that companies can write off the full cost in the first year. It’s difficult to say if that will be enough to promote capex increases across the spectrum for both small and large companies, if the tax reduction benefits for small business is marginal and not sizeable, as appears to be the case.
Conclusion
Capex appears to be set to increase in 2018, however the increase may only occur for corporations as opposed to small businesses, as a function of the revised tax code. If this improvement is a result of better economic conditions this is great news for productivity and wage growth in the next few years. If however this creates a larger competitive imbalance between corporations and small business, unemployment could increase along with consumer prices for goods and services as a function of less competition. There are lots of variables to consider and not everything is so black and white. Remember, the economy is a complex system. We’ll be following up on capex spending in 2018 to see if it meets expectations.
Have comments? Join the conversation on Twitter.
Disclaimer: The content on this site is for general informational and entertainment purposes only and should not be construed as financial advice. You agree that any decision you make will be based upon an independent investigation by a certified professional. Please read full disclaimer and privacy policy before reading any of our content.


