UPFINA's Mission: The pursuit of truth in finance and economics to form an unbiased view of current events in order to understand human action, its causes and effects. Read about us and our mission here.
Reading Time: 5 minutes
Looking at the global economy in terms of demographics tells us a lot more than meets the eye if you know what to look for. The obvious narratives are that the emerging markets have young populations which are growing quickly (excluding China). This along with the inclusion of free markets has led to their economies adding millions of people to the middle class. On the other hand, the developed countries are enduring an aging population which means more reliance on government programs like Medicare, Medicaid, Social Security and lower tax income, straining the balance sheets of the governments.
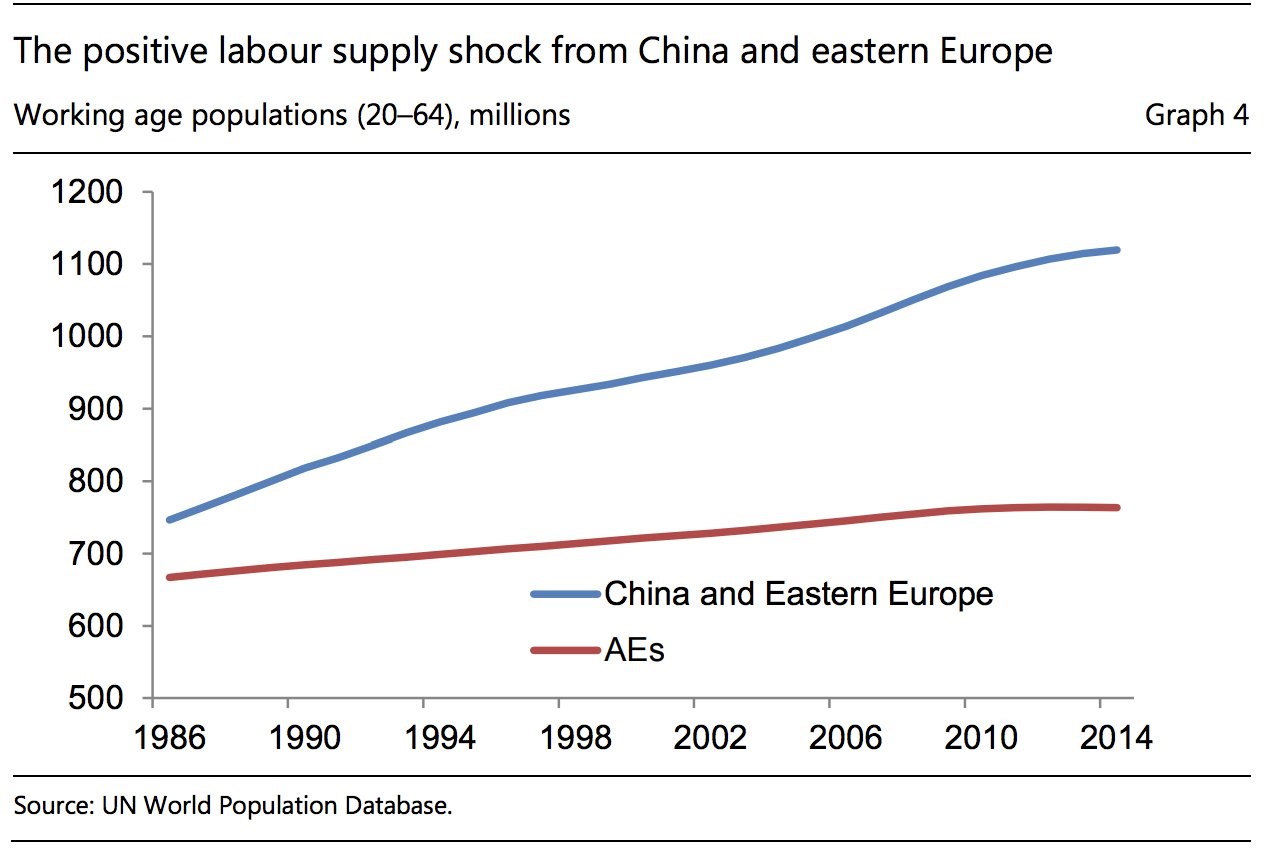
Those are the basic effects, but using demographic trends can help us predict more economic metrics such as changes in wages, inflation, inequality, and stock market valuations. One of the most important changes in demographics was the addition of labor supply from China and Eastern Europe since the 1980s.
As you can see from the blue line below, over 300 million workers aged 20-64 were added to the global workforce from those regions from the mid-1980s to the mid-2010s.
Labor Supply Shock Lowered Wages
This influx of labor pushed down wages and pushed up inequality within countries, but pushed down inequality between countries. It weakened private sector trade unions, lowered interest rates, and lowered inflation. Lower wage growth in America reduces the incentive companies have to make workers more productive. This means less private fixed investment which would improve productivity growth. Low interest rates support the stock market, giving it a higher earnings multiple. This encourages corporations to flood the market with buybacks, further pushing stocks higher.
This explains the current situation we are in as wage growth has been low and stocks have been rising. The reason this trend is pivotal to highlight is because it is reversing. The chart below shows the baby boomers retiring in America, lowering the ratio of the working age to the total population.
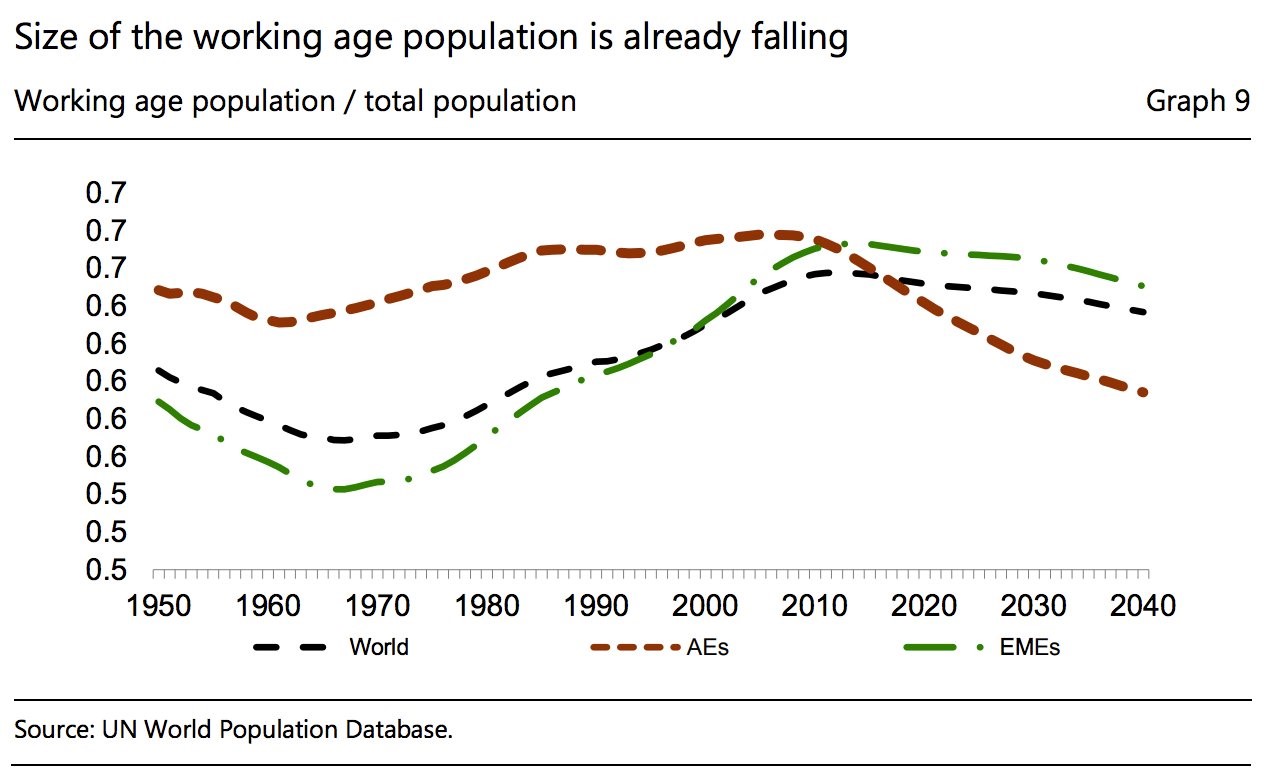
Working Age Population Ratio Will Reverse Labor Supply Increase
Other advanced economies are seeing similar demographic changes America has seen which is why the red dotted line is falling. As you can see from the green dotted line, the increase in the emerging markets’ working age to total population ratio is also ending, thus reinforcing this new economic scenario. The one counterpoint to this chart is that an aging population means many more people will be working later in their life. The thesis that the macroeconomic trends change because of the aging population assumes that factor isn’t strong.
An aging population means less workers will be available in relation to the entire population which means wages will rise. The chart below shows the consumption life cycle.
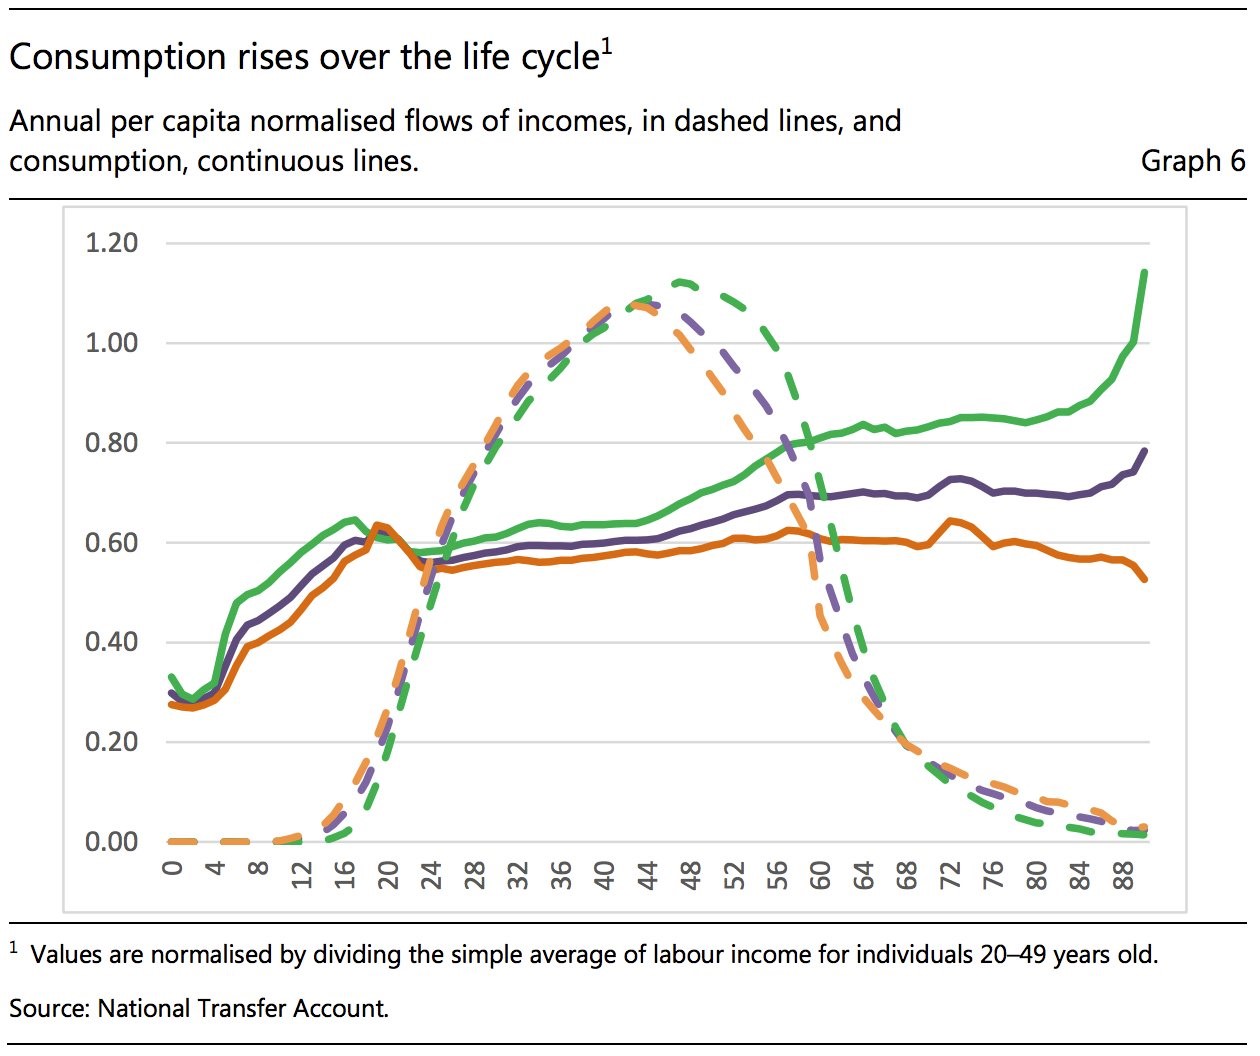
Consumption Life Cycle
In a person’s 40s his/her consumption increases. More demand for products means more inflation is coming. This applies to emerging market economies. We’ve looked at the life cycle dynamic in America as well in a previous article. Wealth peaks right at retirement because that’s when earnings halt. That has pushed stocks higher as baby boomers need to put their savings somewhere. In a low interest rate environment, there’s not many other places for the money to be parked. This leads us to the other potential change in the current environment which could result from the shift in global labor force dynamics: higher interest rates. The aging population could cause savings to fall more than investments which would increase real interest rates.
The two charts below could see a reversal if real rates rise. The chart on the left shows the average of 15 developed market bonds and stocks. The chart shows in the past 200 years, the bond and stock valuations have never been higher. That’s what happens when inflation is low (as measured by the CPI), buybacks are high, and nominal interest rates are low.
The chart on the right breaks down the inputs to this chart as the 10-year cyclically adjusted earnings multiple is historically high and the 10 year treasury yield is near its lowest level ever. The changes predicted by demographics make the seemingly obvious forecast that bond and stock valuations can’t stay near the 100th percentile forever.
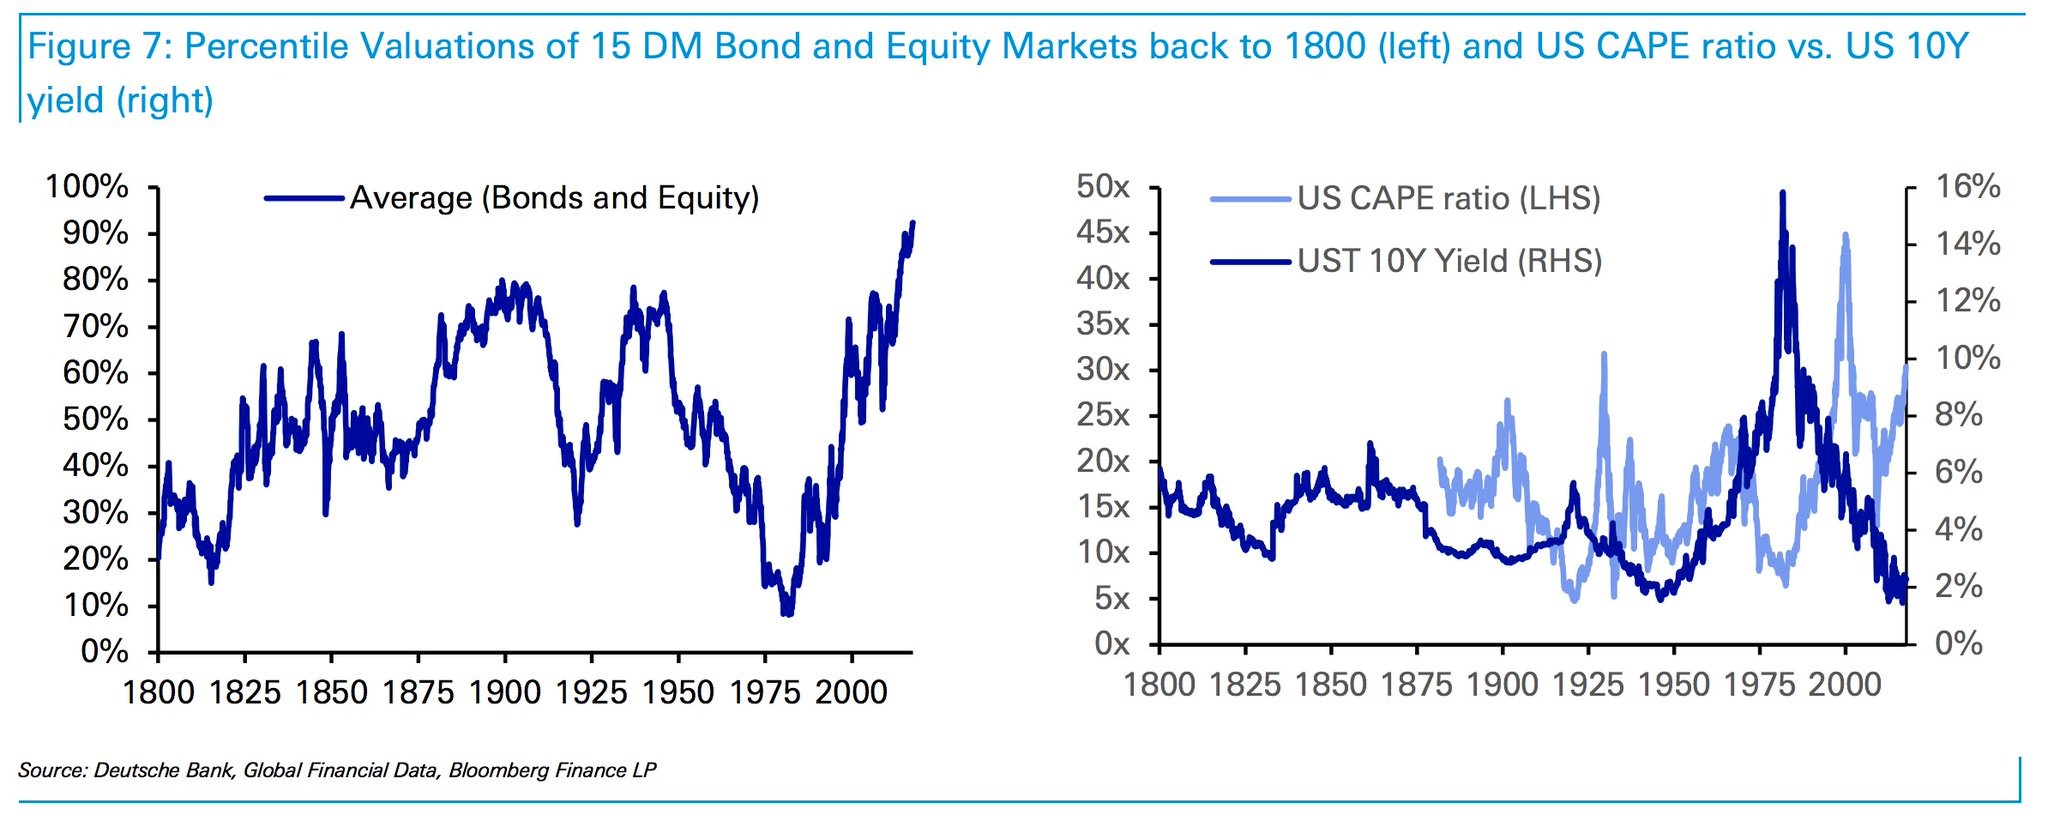
Bonds And Stocks Most Expensive Ever
As was mentioned, the dynamics which have created the current scenario for the stock market will be changing. One factor that could change is that rising interest rates make it cheaper to use equity financing instead of debt financing as we detailed in the Cost of Debt Vs. Cost of Equity article. This could push stock valuations lower as the supply of stocks increases. Many of the firms which issued an inordinate amount of debt might be in a bind. Rising rates, forcing them to issue shares will cause their stocks to fall sharply. Corporate debt to GDP is at a record high, so this could be a big problem. Declining interest rates explain why the corporate debt to GDP ratio has been in a multi decade long uptrend, intermittently falling during recessions, but always rising to a higher level.
The debt overhang corporations face is nothing compared to what governments face. Rising interest rates combined with an aging population that will take more from the government through transfer payments than it gives through paying taxes could be a deadly combination. The hope is that nominal wage growth means more income taxes will be paid. If not, the central banks will be ready to expand their balance sheets to never before seen proportions to help the government pay back its loans at low rates. The problem is this time there will be rising inflation, penalizing the potential QE, making it a less optimal solution. If you question the possibility of the central banks ever acting this political, turn your attention to the current ECB policy which has low rates to sustain the periphery nations. Without bond purchases, Italy and others would be in a world of hurt and the discussions of a break up of the EU will be back on the table.
Conclusion
Many bullish investors who are buying ETFs cannot see a scenario where valuations come back in line because they are so used to stocks being called expensive. The term expensive has become meaningless because everyone says it, yet stocks soar. The correct way to put it is stocks are expensive if price inflation, as measured by the CPI, rises. In that case, figuring out where price inflation goes will tell you when stocks might selloff. Predicting where earnings will go gives you a thesis on the cyclicality of the market, while the macro demographic trends explain the changes to the market structure over decades not years.
Have comments? Join the conversation on Twitter.
Disclaimer: The content on this site is for general informational and entertainment purposes only and should not be construed as financial advice. You agree that any decision you make will be based upon an independent investigation by a certified professional. Please read full disclaimer and privacy policy before reading any of our content.


