UPFINA's Mission: The pursuit of truth in finance and economics to form an unbiased view of current events in order to understand human action, its causes and effects. Read about us and our mission here.
Reading Time: 5 minutes
One of the most heated debates on whether the bull market has run its course is about household wealth. The bearish investors claim that since household wealth as a percentage of GDP is at a record, the cycle must end, while the bullish investors disagree because there is no specific wealth cap in relation to GDP. A similar discussion is had in relation to incomes as the net worth to income ratio is also at a record high. This is caused by demographics skewing older, the near record long expansion, and the record long bull market. Older people have more wealth because they have had more years to earn and build savings than younger people.
The Daily Shot chart below shows stocks have catalyzed the increase in household wealth.
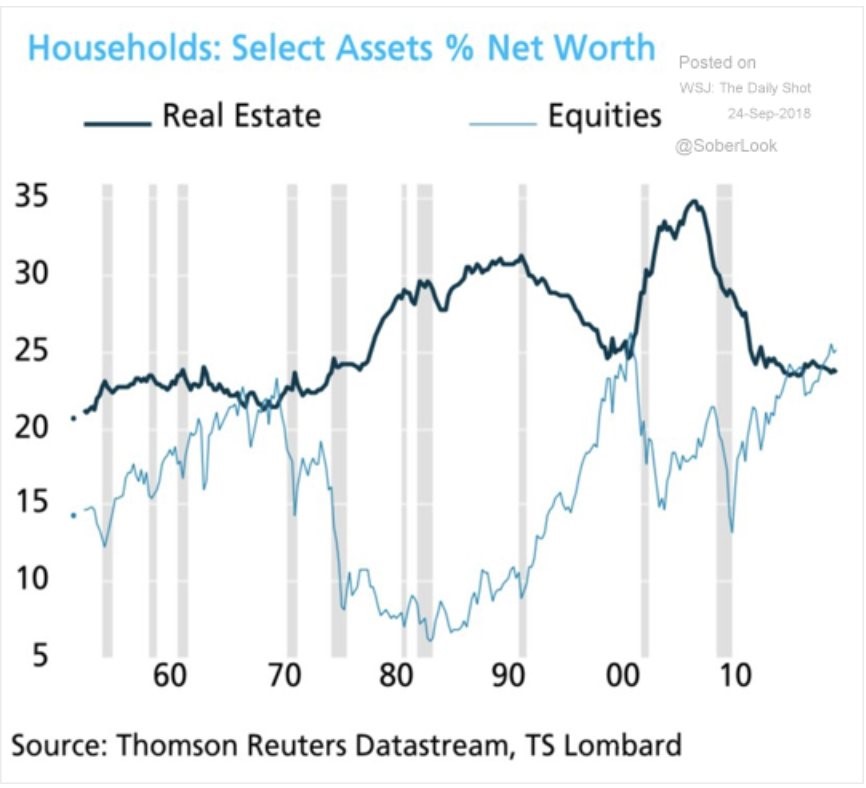
Comparing household wealth to GDP is a variation of comparing stocks to GDP which we already know is wrong because of increased international earnings. There is inverse relationship because all the assets households own can only get to 100%. Stocks were a small part of household wealth in the 1980s while real estate increased in value. Real estate declined in the 1990s while the tech bubble exploded. We’re once again in a position where stocks are doing well while real estate isn’t a historically large part of household wealth. Stocks are near their 2000 peak and above the late 1970s peak. Ultimately, earnings growth and this expansion will determine stock prices, but this chart is food for thought for both bulls and bears.
Is Housing Affordable?
Even though real estate is a historically low portion of wealth, that doesn’t mean it has been doing terribly because household wealth is extraordinary. We’ve previously discussed how this is an interesting period because consumers think the economy is in a great position to buy a house, but buying conditions are the worst since 2008 because of how expensive housing has become.
Housing has been one of the leaders in CPI as it has driven inflation during this cycle. Rising interest rates add to the increased cost of home ownership. This explains why we’ve seen weakness in the housing market this summer. The August seasonally adjusted existing home sales fell 1.5% year over year in July and August. Median sales prices for existing homes fell 1.7% month over month to $264,000, but they increased 4.7% year over year.
The chart below shows the latest national home affordability estimate.
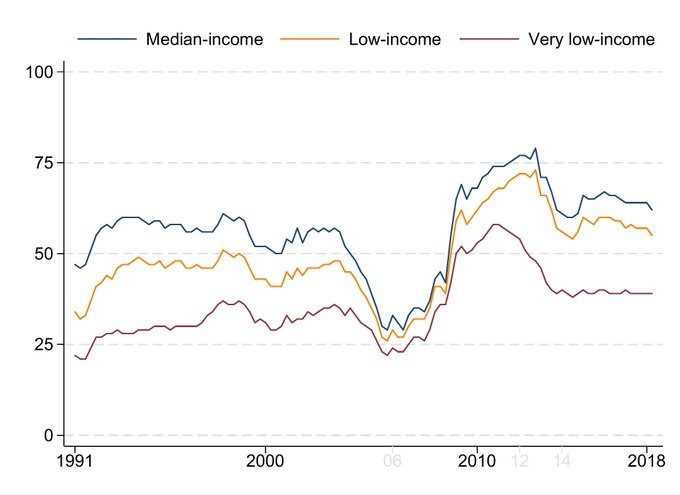
This chart is interesting because it shows how home affordability has changed for low income and very low income earners. Low income earners are 80% of the area median income and very low income is 50% of the AMI. As you can see, the housing crisis allowed housing to be affordable to even very low income earners. Affordability has recently been dropping for median and low income earners.
Which Cities Are Affordable For The Poor
Since all real estate is local, it’s interesting to see the dispersion among various metropolitan statistical areas. As you can see in the chart below, it’s very different for various parts of the country.
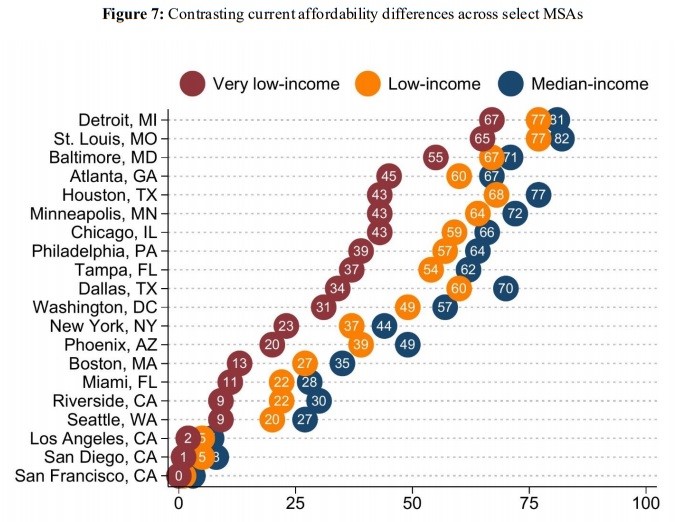
The 2008 housing crisis was unique because of how correlated each housing market was. The current affordability is horrendous in the major California cities as even median income earners have very little chance of owning a house.
The situation is much better in the Midwest, but St. Louis has an extremely high murder rate, meaning there’s a reason it’s affordable. There’s no free lunch in investing or home buying as any benefit will come with a new cost. However, that’s not to say there aren’t advantages to moving which can work for you. It all depends on your values. We mentioned the murder rate in St. Louis because safety is universally valued.
Each Person Has More Wealth
In a previous article, we mentioned how housing prices look less problematic if you consider the increased size of houses and the declining size of households. In a similar mold, if you adjust real incomes for household size, they show much more improvement. The average household size hit a record low in 2016 at 2.53 and increased slightly to 2.54 in 2017. This is down from 2.94 in 1975 and 3.56 in 1947.
As you can see in the chart below, average real income per household member and median real income per household member have increased more rapidly than without the household adjustment.
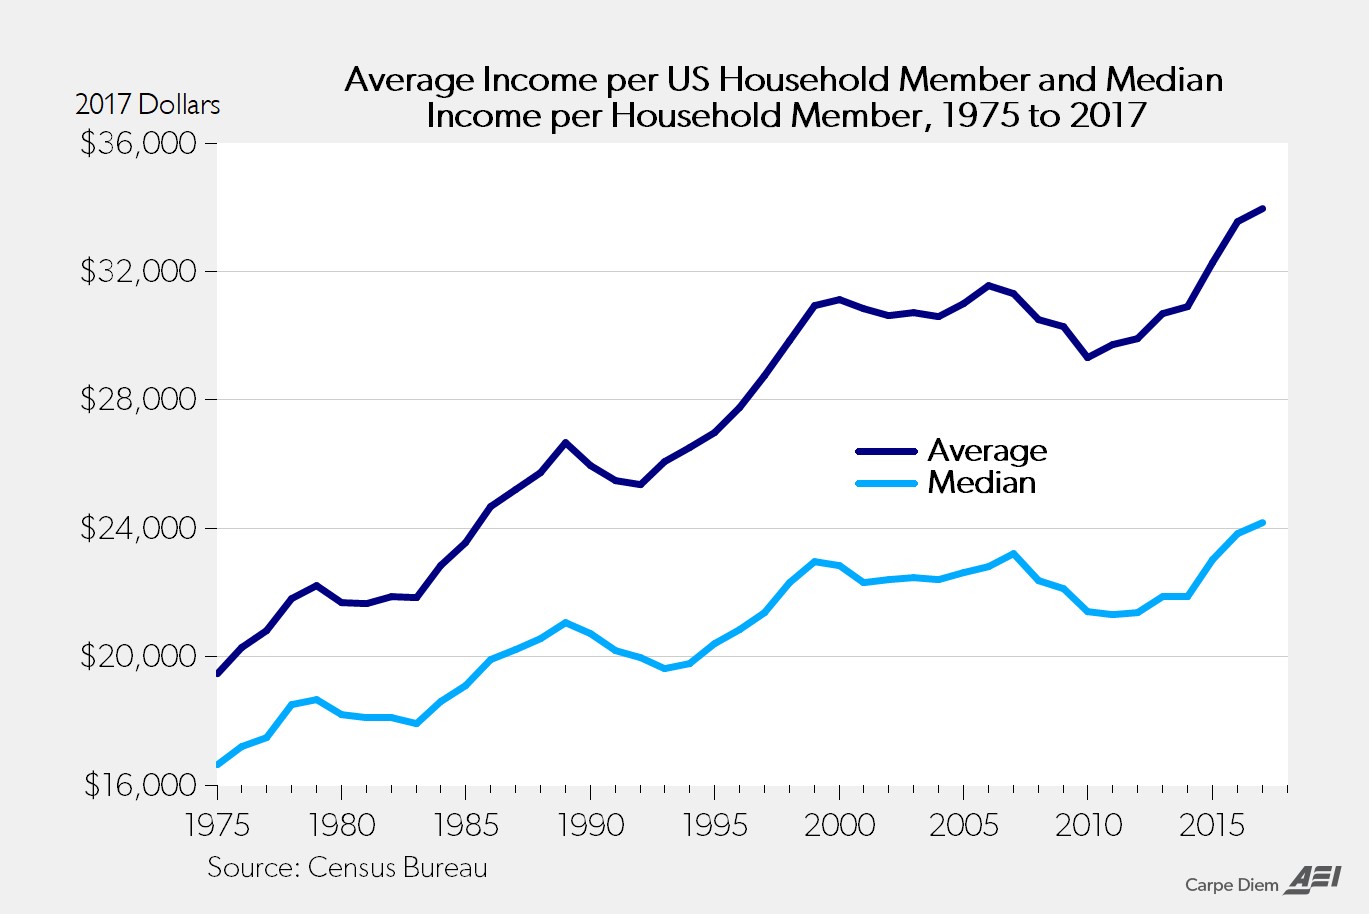
The average increased from $19,500 in 1975 to $34,000 in 2017 which was a 74% increase. The median increased from $16,600 to $24,160 which is a 45% increase. Without adjusting for the size of households, the results are a 50% and 25% increase. Each person in America is much wealthier. You can say household sizes have fallen because people can’t afford to raise kids, but the reality is richer countries have smaller families. That being said, student debt does delay household formation which shrinks the window for having kids.
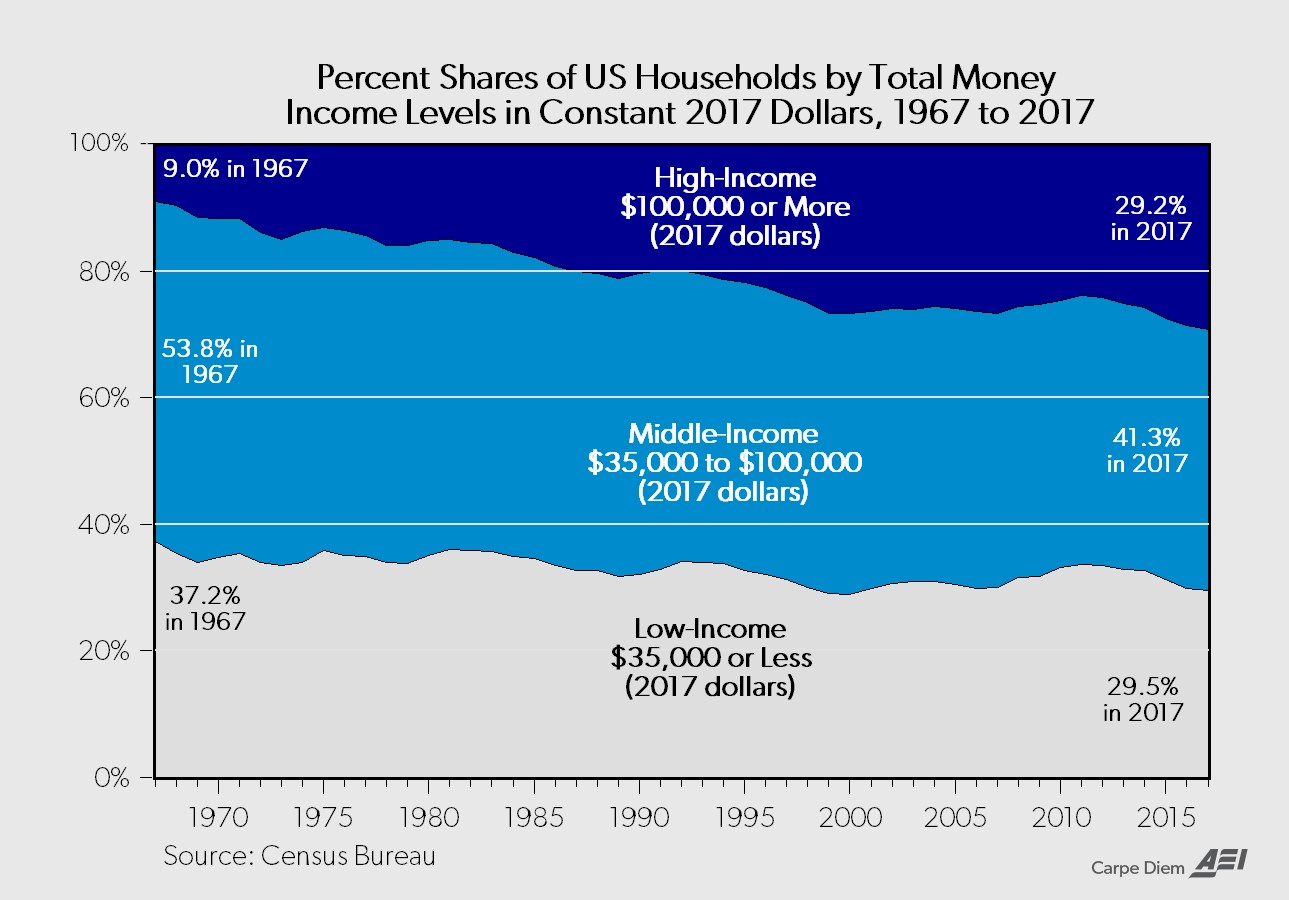
Poverty Is Down And Wealth Is Up
Even though the shrinking middle class is thought of as a bad thing, it’s obviously not if more people are becoming rich. It’s better to review each income category in real dollars instead of percentages because if incomes are rising for each group, it’s not automatically bad if the top is growing quicker than other categories. The chart below shows how middle income earners are graduating into the high income group and low income earners are graduating into the middle income group in real terms. It’s happening faster at the top, but both trends are positive. It’s becoming more accessible than ever for households to earn $100,000 or more.
Conclusion
Households wealth is soaring because of stocks which could be bad news for equities. Housing is becoming less affordable, especially for median and low income earners. Rising rates will hurt the situation. Some cities are affordable, but usually as prices fall, so do living conditions. Real median income growth has been weak for the past few decades, but on a per person basis, it has been strong. Americans have never been this well off. The high income group is coming close to being the largest income group as earning $100,000 is becoming more accessible.
Have comments? Join the conversation on Twitter.
Disclaimer: The content on this site is for general informational and entertainment purposes only and should not be construed as financial advice. You agree that any decision you make will be based upon an independent investigation by a certified professional. Please read full disclaimer and privacy policy before reading any of our content.


