UPFINA's Mission: The pursuit of truth in finance and economics to form an unbiased view of current events in order to understand human action, its causes and effects. Read about us and our mission here.
Reading Time: 4 minutes
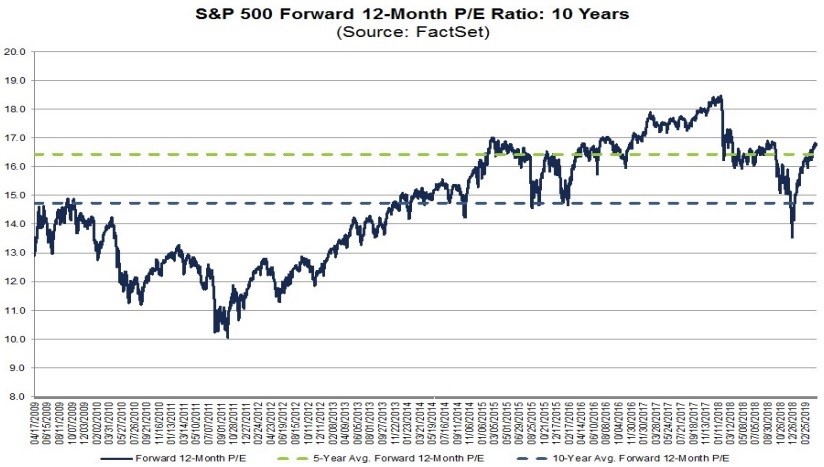
The market has recovered the losses from its mini-bear market last year. While that sounds great, it means that valuations have returned to the same place which is heightened. As you can see from the chart below, the almost 17 forward PE multiple on the S&P 500 is about 2 points above the 10 year average and slightly above the 5 year average.
As we will get to in the next section, stocks trade off the rate of change in analysts’ future estimates. Valuations come into play when measuring the delta of movements. For example, if earnings estimates don’t fall as much as average, but actual growth is in the low single digits and stocks rally in the double digits, that movement isn’t sustainable. According to FactSet, S&P 500 earnings growth is expected to be 3.4% in 2019, yet the S&P 500 is up 16.73% year to date. Multiples expanded at the start of the year because in late 2018 stocks anticipated a recession in 2019. However, the recovery is over and the forward multiple is quite high.
Continued Solid Q1 EPS Results
To be clear, the elevated forward PE multiple isn’t a red flag to get out of the market and start shorting. It’s a warning sign that encourages prudence. As of Tuesday, 74.4% of S&P 500 stocks were above their 200 day moving average. That’s the highest since February 2018. The cycle peak early in this expansion was 96%. The most recent peak was 83.6%. Stocks haven’t reached extreme euphoria yet. The difference between the percentage of bulls and the percentage of bears in Ned Davis Research’s survey was 35%. While that is elevated from the negative reading that was hit at the trough late last year, it’s below the about 50% reading that was hit in January 2018.
As we mentioned earlier, stocks trade off the rate of change of estimates. These aren’t pie in the sky guesses by analysts. These are based on forward guidance companies give out. Companies gave out tragic guidance last quarter and are giving out sequentially improved guidance this cycle. The table below shows earnings growth is now positive in Q1. However, what really matters to stocks is the 2nd column which shows the Q2 estimates.
Estimates have gradually fallen this earnings season instead of collapsing. Guidance hasn’t been a disaster which is good news. That being said, there’s a limit to how much stocks can go up based on low single digit earnings growth which we mentioned in the previous section.
New Home Sales Beat Estimates
There has been a lot of bad news coming from the housing sector recently as existing home sales as well as starts and permits all missed estimates. Making matters worse, the MBA Applications index’s growth rate, which was the bright spot for the housing market, has recently turned south. It’s possible that the increase in buyer interest as a result of the drop in mortgage rates has dried up. Specifically, in the week of April 19th the purchase applications index’s weekly growth rate fell from 1% to -4%. On a yearly basis, the growth rate fell to 3%; the 3 week moving average is now 7.6%.
Amidst the weakness from all these data points, we received a great new home sales report to give us some optimism. New home sales account for about 11.7% of the housing market. As the chart below shows, March new home sales were 692,000 on a seasonally adjusted annualized basis.
This beat the high end of estimates which was 660,000 and the consensus of 645,000. It was an increase from 662,000 in February. This was the best report since November 2017.
The number of new homes sold may have been juiced by builders giving out discounts as the median price of new homes sold fell 0.3% monthly to $302,700. The yearly growth rate was -9.7%. Prices probably won’t continue that decline since sales were up 3% yearly. Supply fell 0.3% to 344,000. Monthly supply on hand fell from 6.3 months to 6 months which is still plentiful.
In the West sales increased from 165,000 to 176,000, but yearly growth was -4.3%. The South, which is the biggest housing market, saw sales increased from 387,000 to 401,000; yearly growth was a powerful 9.3%. This was the highest level of sales since July 2007. Monthly new home sales in the Midwest increased 17.6% to 87,000 and they fell 22.2% in the Northeast to 28,000.
As you can see from the chart below, the ratio between existing home sales and new home sales is continuing to normalize.
New home sales are up 4 out of the past 5 months, while existing home sales are flatlining. If the ratio continues to normalize and existing home sales don’t crater, new home sales will continue to increase.
Fiscal Stimulus In Its Last Gasp
While it’s potentially impressive for the U.S. economy to grow 2.4% in Q1 given the global slowdown, it’s not that impressive if you include the effect of the fiscal stimulus. As you can see from the chart below, the effect of the fiscal stimulus is highest in Q3 2018 and Q4 2018. It is projected to help Q1 2019 GDP growth by about 0.5%.
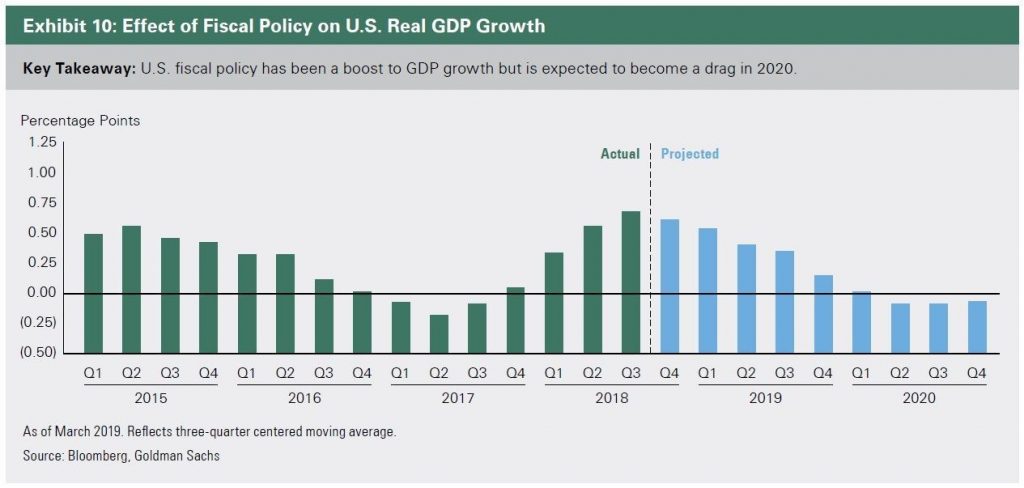
This effect is expected to wane to close to 0% by Q1 2020. Hopefully, the ECRI leading index is right about the economy having a cyclical upturn at the start of 2020 because it will need to, to prevent a drop off due to the stimulus’ effect ending. Historically, we might look back at the timing of the fiscal stimulus as lucky because it helped prevent this slowdown from getting worse and turning into a recession.
Conclusion
The forward PE multiple is getting elevated which signals stocks might soon run out of room to rally. On the positive side, Q2 earnings estimates have declined at a more gradual pace than last quarter. Most of the recent data on housing has been weak except for the solid new home sales report that was helped by every region except the Northeast. Finally, the fiscal stimulus’ effect on GDP growth will fall throughout 2019 which means the economy needs to have a cyclical recovery to prevent this slowdown from getting worse.
Have comments? Join the conversation on Twitter.
Disclaimer: The content on this site is for general informational and entertainment purposes only and should not be construed as financial advice. You agree that any decision you make will be based upon an independent investigation by a certified professional. Please read full disclaimer and privacy policy before reading any of our content.


