UPFINA's Mission: The pursuit of truth in finance and economics to form an unbiased view of current events in order to understand human action, its causes and effects. Read about us and our mission here.
Reading Time: 5 minutes
It’s news to no one that the stock market has had a fantastic start to the year. The S&P 500 is up 15.51% year to date. Its total return is only down 0.1% from its September record high. This great run comes with issues, namely the CNN fear and greed index is at 74 out of 100 which is on the cusp of signaling extreme greed in the market. The S&P 500 is on an 8 day winning streak which is the longest since October 2017. The obvious point that stocks can’t go up every day is being questioned.
Be Careful Of Going All In
Investors are getting short the VIX which is a bet on low volatility and rising stock prices. The short VIX trade is notable for being somewhat responsible for the correction early in 2018. As the chart below shows, the net positioning short the VIX is similar to the period prior to the mini-bear market in Q4 2018.
Inflated Credit Scores
One of the biggest risks to the economy is that many banks and other institutions have lower lending standards than they think. In the last cycle, it was obvious that consumers with low credit scores would default on mortgages they couldn’t afford when the economy worsened. Plus, loans were structured in such dubious ways such as teaser rate mortgages; that was when low introductory rates were offered. Once the introductory rate ended, borrowers had a tough time paying back the loan. Those with adjustable rate mortgages were in an even bigger struggle as payments kept rising as the Fed hiked rates.
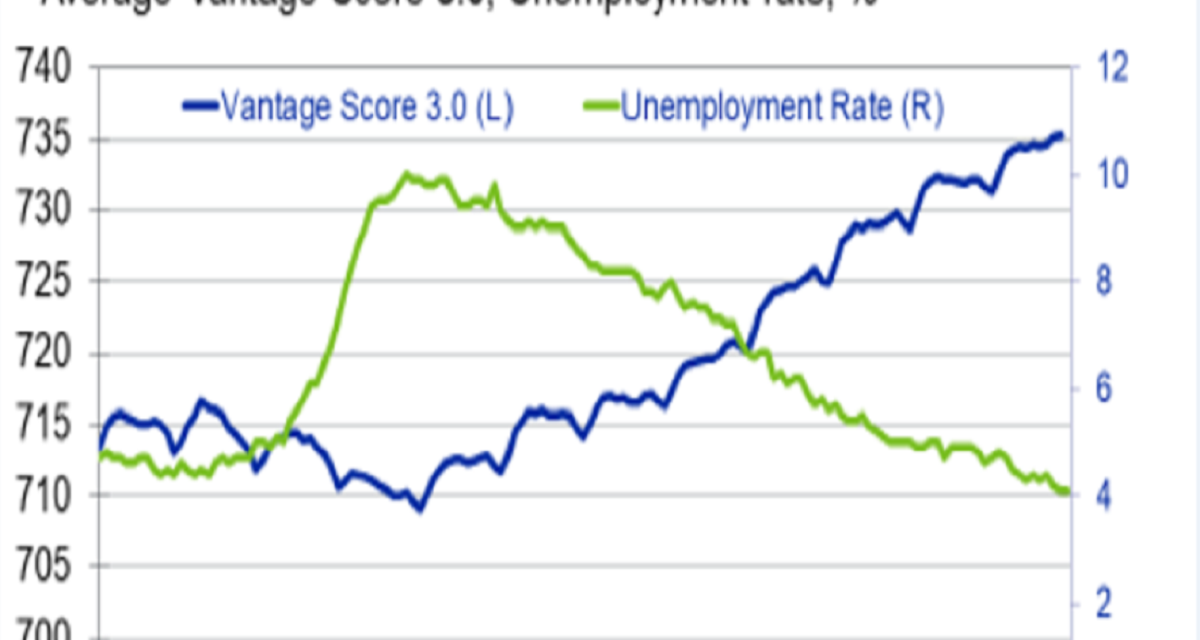
In this cycle, loans look good because borrowers have a seemingly high credit score. However, if most consumers have a high score, what does it really mean? If the average person could get into an Ivy League university, the diploma would be worth much less than it is now. As you can see from the chart below, the average Vantage 3.0 score increased from between about 710 and 715 from 2006 to 2011 to about 735 as of 2018.
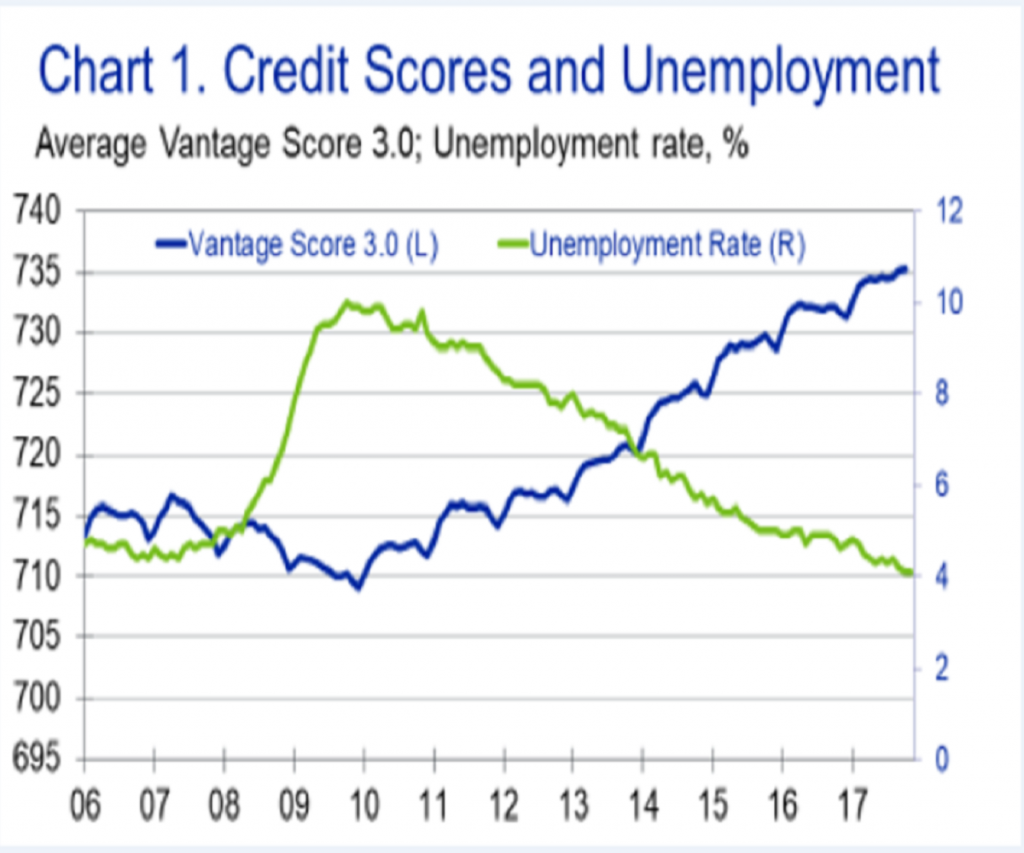
It’s fair to note that the improved labor market helps people pay back loans on time. It may not be the best idea for lenders to keep the same credit score standards when scores are up because the average could fall in a recession. The improved labor market doesn’t explain why the average score is higher than it was before the financial crisis. Part of the reason scores are higher could be that consumers are less leveraged this cycle. Without having an unaffordable mortgage payment, it’s easier to pay other bills on time. It’s also easier to access scores online than it was 12-13 years ago. Seeing how a missed payment can hurt scores, motivates people to avoid doing so.
Boosted Scores
Experian is offering customers the opportunity to boost their score by adding a payment history to their credit history. Paying a bill on time certainly means a customer is responsible. However, if it is a new way to increase scores, the higher score is less meaningful. To be clear, if the attempted boost lowers their score, users can take the payment history off.
There have been other changes that have boosted credit scores this cycle. Tax liens are no longer part of credit reports. Traffic tickets, missed gym membership fees, and late library books aren’t included because credit reports can only include a contract or an agreement to pay. Also, medical debts that are less than 180 days old aren’t included on credit reports anymore.
FHA Tightening Standards
Just as first time home buyers are catching a break because interest rates are collapsing, home price growth is slowing, and home builders are starting to build lower priced housing, the FHA is looking to clamp down on underwriting standards. As you can see from the chart below, the average FHA borrower’s FICO score has fallen from 700 to 670. That’s while it has become easier to get a high credit score. The average FICO score of 700 for FHA borrowers in 2011 was about 10 points below the average Vantage 3.0 score. The 670 average in 2018 is over 60 points below the average Vantage 3.0 score.
The chart on the right shows the share of borrowers whose debt is more than half their income. If credit scores are in doubt, the best way to look at borrowers is debt to income. About 5% more borrowers have a debt to income ratio above 50% than at last cycle’s peak. To be clear, this is for government backed loans; private lending is in much better shape.
As you can read from the slide, the government is reversing its 2016 decision to loosen lending standards. In 2016, it removed the rule that required manual underwriting for mortgages with a credit score below 620 and a debt to income ratio above 43%. This is a great decision as we don’t want such high debt to income ratios to be common. Once the labor market weakens, many borrowers with debt making up over half their income will be in trouble as budgeting is very tough in such a scenario. Job losses are impossible to cope with in such a scenario.
BLS Report Can Be Revised
We already made the point in a previous article that the BLS report isn’t a leading indicator. However, temporary professional and business services payrolls might hold the key to future economic performance because it is easier to let go temporary workers than permanent workers. Temp workers are easier to replace. The average monthly change in temp payrolls in 2019 has been -9,500. That’s worse than the 12 month change where 3,700 were added. In 2018, there were 7,000 temp workers added on average and in 2017, there were 6,000 added per month. This weakness in temp payrolls could be a negative signal for the economy going forward.
Changes To GDP
The initial GDP report is similar to an educated guess at how the economy did. It’s fair to point out that 2008 was rare because it included a severe recession. However, the one time we needed to know how the economy did, the GDP report let us down. The advanced estimate for Q3 2008 GDP growth was -0.3%. Even worse, the final estimate was 0.5%. The 2018 revision shows growth was actually -8.2%. It took until 2010 for the BEA to recognize growth was negative in Q1 2008. The recession was over by then.
Conclusion
The stock market is showing potential overvaluation relative to economic signals. That doesn’t signal anything about short term returns as overvaluation often begets more overvaluation. It’s just worth noting. Credit score calculation changes that make it easier to get a good score, the consumer deleveraging, and the improved labor market have pushed up the average credit score. While scores increased, the average score for FHA loans decreased. That’s partially why the FHA is tightening lending standards. The decline in temp workers could signal potential labor market weakness. Initial and even final GDP reports are meaningless in big recessions. The BEA realized there was an economic contraction in 2008 only in 2010.
Have comments? Join the conversation on Twitter.
Disclaimer: The content on this site is for general informational and entertainment purposes only and should not be construed as financial advice. You agree that any decision you make will be based upon an independent investigation by a certified professional. Please read full disclaimer and privacy policy before reading any of our content.


