UPFINA's Mission: The pursuit of truth in finance and economics to form an unbiased view of current events in order to understand human action, its causes and effects. Read about us and our mission here.
Reading Time: 4 minutes
Because of the government shutdown, spending and inflation data from February and March came out together along with March income data. Everyone who was confused about the low GDP deflator in the Q1 GDP report was brought up to speed somewhat since the inflation readings in February and March mostly missed estimates. Furthermore, the core PCE reading fell much more than the core CPI reading.
Core PCE Inflation Craters
Specifically, headline February inflation was 1.3% which was down from 1.4%. Core PCE inflation fell from 1.8% to 1.7%, missing estimates for 1.8%. Furthermore, headline PCE inflation was 1.5% in March which increased from February, but missed estimates for 1.7%. Even with oil prices starting to spike higher, headline PCE inflation is considerably below 2%. The March PCE reading had energy prices up 3.6%. Headline PCE inflation is still below core PCE inflation which fell from 1.7% to 1.6% which missed estimates by 0.1%. That was the weakest reading since January 2018.
The chart below shows the heightened difference between core CPI and core PCE. On an unrounded basis, core PCE is below core CPI by 48 basis points.
As recently as mid-2017, the difference was only 8 basis points. The largest difference in the past 4 years was at the start of 2016 when core CPI was 84 basis points above core PCE. You can see in the chart how they were nearly identical from 2011 to 2013.
Could The Fed Cut Rates?
Inflation skeptics follow headline CPI the closest because it’s usually the highest. We use headline CPI as the deflator for real wage growth, but PCE works too. The key difference between the two is the Fed follows PCE closer than CPI. Without the Fed, we wouldn’t care as much about each decimal point of core inflation because it wouldn’t mean much. Just imagine how close we would follow durable goods orders growth if yearly growth above 5% meant possible rate hikes. The Fed has stated it follows PCE inflation, but in practice it reacts to core PCE when setting policy.
As you can see from the chart below, with the decrease in the core PCE inflation rate, the real Fed funds rate is spiking. It is almost at 1%.
The past 3 cycles saw the real Fed funds rate deflated by core PCE peak much higher before rate cuts and recessions ensued. Even if it follows the recent trend of lower peaks, it’s not very elevated. However, the median FOMC estimate for the neutral real Fed funds rate is now below the real Fed funds rate. The difference is tiny now, but if core PCE falls a bit more, it could cause the Fed to either raise its estimate of the neutral real Fed funds rate or cut rates.
We think the Fed is most likely to take the easy way out and change its estimate. The Fed doesn’t like to box itself into a corner on policy. It usually does the opposite by allowing itself the most possible options. In terms of rate cut odds, the CME Group FedWatch tool shows there is a 65.7% chance of a rate cut this year. There’s a 70.6% of a cut by next January. Even though the market is pricing in a cut, the Fed could easily follow its current guidance and raise rates next year if this slowdown ends.
To be clear, the Fed doesn’t need to cut rates if inflation is weak. It needs to cut rates if the economy is very weak and the labor market is in trouble. Neither of those two are the case. The Fed is in a great position because the economy is growing and inflation is low. The Q1 GDP report wasn’t fantastic, but the ECRI leading index is now showing 1.4% yearly growth. The March coincident index showed yearly growth fell from 2.5% to 2.1%. It is still above last slowdown’s trough of about 1%. If the ECRI leading is correct, the worst of the slowdown will be in Q2 and Q3.
Personal Income Growth Falls & Spending Growth Rises
March personal income growth missed estimates and consumer spending growth beat estimates. That’s a recipe for a declining savings rate. Specifically, personal income growth was 0.1% on a monthly basis which missed estimates for 0.4% growth. Monthly consumer spending growth was 0.9% which beat estimates for 0.7% growth.
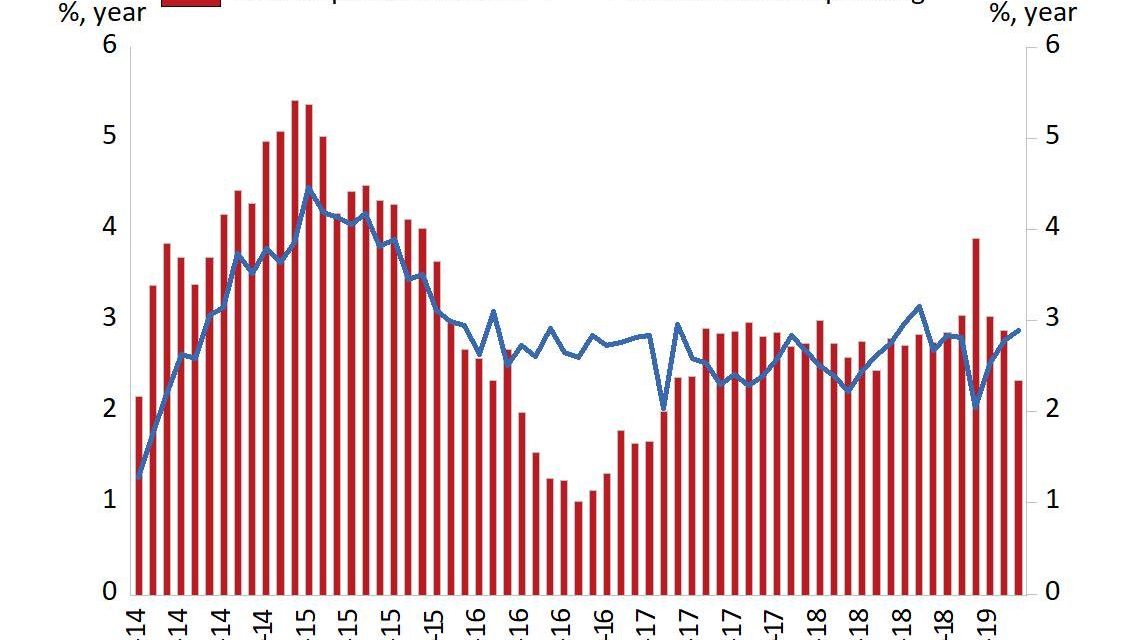
As you can see from the chart below, yearly real disposable income growth was 2.3% in March which was the lowest rate since early 2017.
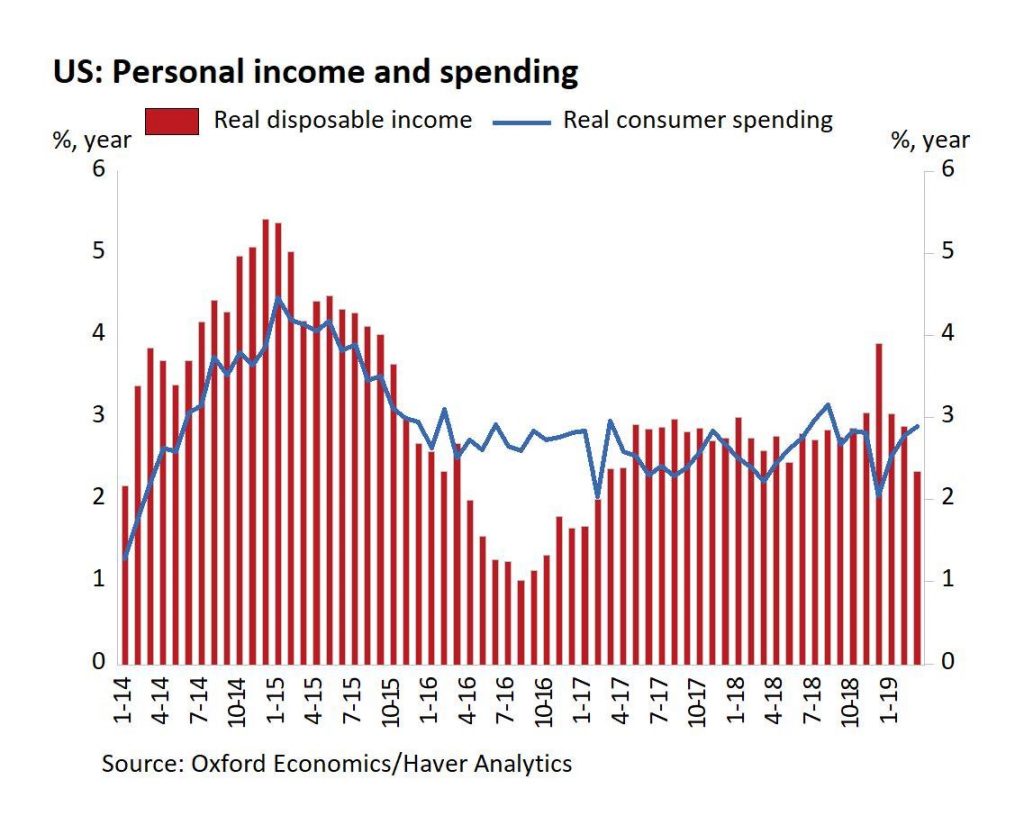
This mini-cycle didn’t start at as high of a rate as the last one; the current growth rate is only about 1% above the 2016 trough. Yearly real consumer spending growth was 2.9%. It is in the same position it was in 2016 except it’s not as far above disposable income growth.
Savings Rate Falls
As we mentioned, when consumer spending growth is above income growth, the savings rate is likely to fall. As you can see from the chart below, in March it fell from 7.3% to 6.5%.
This was the largest sequential drop since January 2013. The good news is this rate is only the lowest since last November. Outside of the initial post-recession period, the lowest savings rate this cycle was 5.8% in February 2013. This rate could drop towards that if consumer spending keeps growing faster than income. It’s more likely that we see consumer spending growth drop than the savings rate crater. Neither are good things.
Income Growth Net of Government Transfers
The chart below shows the 5 year annualized growth rate of real personal income excluding government transfer payments.
33% of transfer payments are social security and 44% are Medicare and Medicaid combined. We look at this to ignore the effect of the government and focus on the private cyclical economy. March’s growth rate dropped to 2.65% which isn’t ideal. Usually when there is a big drop there is a recession.
Conclusion
The Fed is in a great position because economic growth is okay and inflation is low. We’d need to see more economic weakness before the Fed considers cutting rates. The consumer isn’t in as good financial shape as before because income growth slowed in March which hurt the personal savings rate. We could see income growth slow in the next 6 months of PCE reports if the ECRI leading index is correct.
Have comments? Join the conversation on Twitter.
Disclaimer: The content on this site is for general informational and entertainment purposes only and should not be construed as financial advice. You agree that any decision you make will be based upon an independent investigation by a certified professional. Please read full disclaimer and privacy policy before reading any of our content.


