UPFINA's Mission: The pursuit of truth in finance and economics to form an unbiased view of current events in order to understand human action, its causes and effects. Read about us and our mission here.
Reading Time: 5 minutes
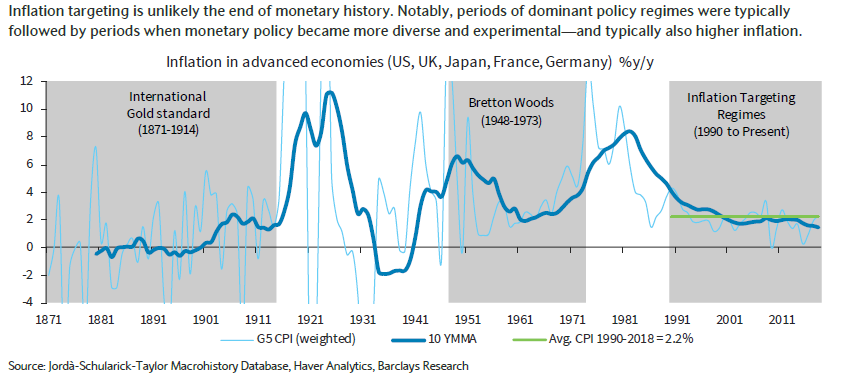
In a previous article, we reviewed the historical American PCE inflation rate. Inflation along with economic growth was more volatile in the 1800s than it has been recently. The chart below reviews the G5 weighted average of CPI. The G5 includes Japan, the U.K., America, France, and Germany.
In both the late 1800s and from the 1990s to present day, the 10 year average inflation rate has been low. The key difference is it was much more volatile in the 1800s as there were several depressions. The word ‘depression’ is basically out of economists’ lexicon because we haven’t seen one since the Great Depression of the 1930s.
The chart indicates diverse and experimental monetary policy led to higher inflation, while dominant policy regimes had low inflation. It’s very clear that inflation spikes during times of geopolitical turmoil as there are embargos, tariffs, and war that prevent the production of commodities. If you fear an inflation spike, don’t worry about the economy hitting full employment. Worry about a conflict.
Homeownership Rate Drops
Unfortunately, the Q1 homeownership rate in America fell from 64.8% to 64.2% as you can see in the chart below. That’s the lowest rate since Q1 2018.
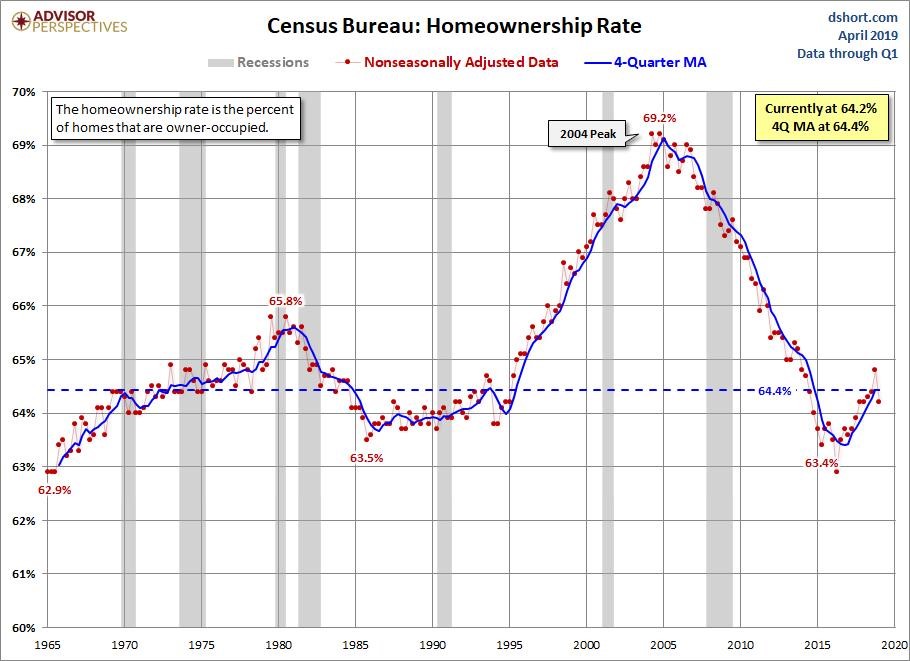
Even though the economy has been in an expansion for almost 10 years, the rate recently bottomed in Q2 2016 at 62.9%. This Q1 2019 decline is probably a bump in the road on the way higher because baby boomers are living in their homes longer and a huge swath of millennials is about to be in the low 30s age group which is prime first home buying time.
Millennials have been delayed by student debt, but they will eventually become more dominant in home buying over the next few years. The strong employment market generating real wage growth certainly helps. It’s highly unlikely that the homeownership rate will hit the 2004 peak of 69.2% again because lending standards are tougher. However, it’s not out of the realm of possibilities to see it match the early 1980s peak of 65.8%.
The FHFA home price index showed price growth fell significantly in February. That’s great news for home buyers who last year claimed it wasn’t a good time to buy a home. Specifically, monthly price growth of 0.3% was down from 0.6% and missed estimates for 0.4% growth. Yearly growth fell from 5.5% to 4.9%. That’s the lowest price growth in 4 years. The Case Shiller index which will be updated next week, last showed price growth was the lowest in 6.5 years.
The West used to be the hottest market, but things have cooled off significantly. The Pacific region had monthly price growth of only 0.2% and yearly growth of 3.7%. The Mountain region saw prices fall 0.5% monthly and yearly growth of only 6.5%; that’s down from 9% growth 4 months prior.
Low End Rental Price Growth Remains High
As you can see in the chart below, in February 2019 national single family rent prices were up 2.9% which is above last February’s growth of 2.7%. The good news is price growth is below the cycle peak of 4.1% in February 2016.
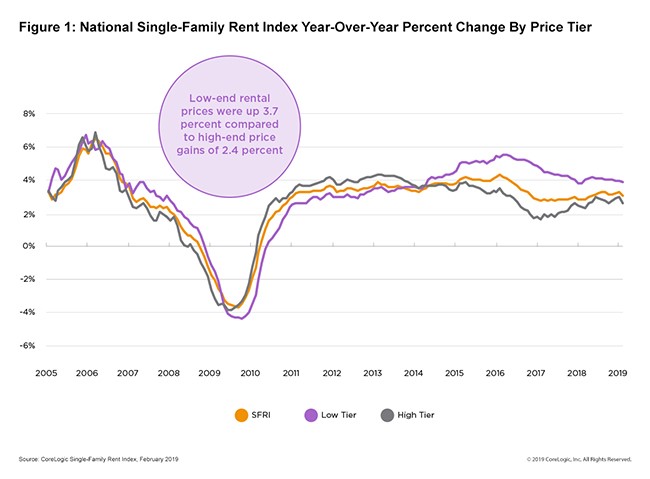
Since 2014, low tier rentals have been seeing faster price growth than the overall market. Low end rental prices were up 3.7%. Low end rentals are defined as rentals that are less than 75% of the regional median. Phoenix had the highest rent price growth as it was 8%. Miami was the lowest at only 1.2%. Phoenix had a supply of 1.9 months and Miami had a supply of 7.6 months.
Strong March Durable Goods Report
This was a very good March Durable Goods Orders report during what was predicted to be a manufacturing recession. This doesn’t even look like a slowdown, let alone a recession. New orders were up 2.7% monthly which destroyed estimates for 0.7% and beat the high end of the consensus range which was 1.9%. Ex-transportation monthly growth was 0.4% which doubled estimates. Core capital goods orders were up 1.3% monthly which beat estimates for 0.1% growth and the high end of the estimate range which was 0.4%. The chart below shows yearly core capex growth was 5.3%. That beat last month’s growth of 2.8%. It was the highest growth since November. The comparison was easier than February’s, but the 2 year growth stack still improved.
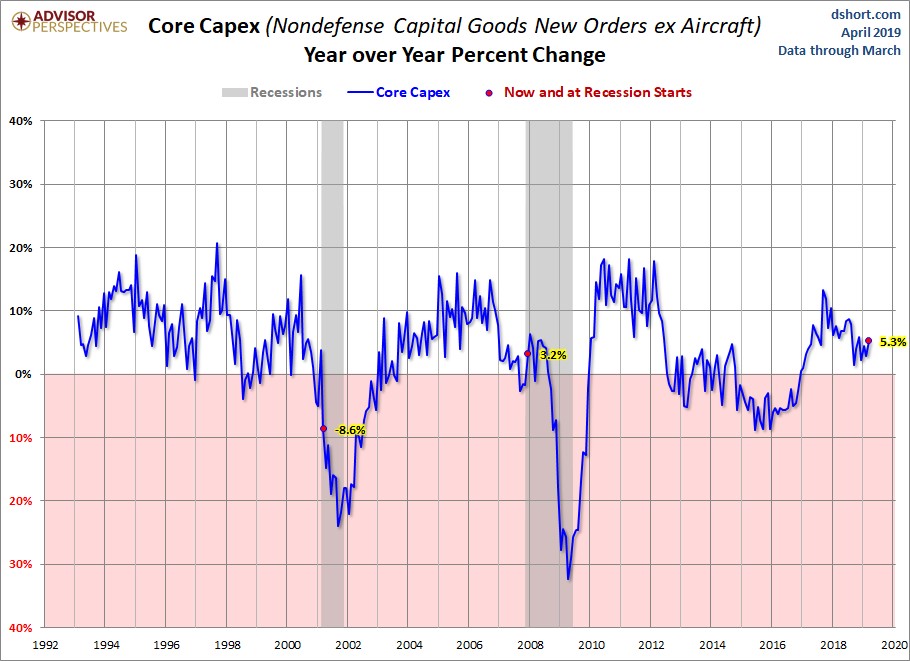
Headline growth was helped by the 60% monthly growth in commercial aircraft orders. Motor vehicle orders were up a strong 2.1%. The strong core order growth signifies a big increase in business investment. However, the impact won’t be kind to GDP in Q1 because core shipments fell 0.2%. Total shipments rose 0.3% monthly. The inventory to shipments ratio was a lean 1.62. This report signals great things for Q2 GDP.
Kansas City Fed Manufacturing Survey Weakens
The April Kansas City Fed manufacturing index fell from 10 to 5. In March it had its strongest reading in 4 months. In April, production fell from 17 to 12, but at least the volume of new orders index increased from 4 to 10. The 6 month expectations composite index fell from 22 to 11. The volume of new orders index fell from 29 to 12. Manufactures aren’t optimistic about the next 6 months. One manufacturing firm was quoted as stating, “Clearly a cooling in some business sectors, primarily consumer and industrial.”
As you can see from the chart below, the 6 month expectations index for the average employee work week fell from 13 to -5. This is the weakest reading since late 2015 when the manufacturing sector was in a recession.
Conclusion
The strong durable goods orders report is good for the Q2 GDP report. Obviously, it’s too early to tell what growth will be in Q2, but it’s a good sign since at the start of the year the ECRI leading index implied growth would be the weakest in Q2 and Q3. The regional Fed manufacturing surveys aren’t perfectly accurate. They may have somewhat led us astray in calling for manufacturing weakness. The Kansas City Fed reading is calling for weakness in April. The homeownership rate should recover its Q1 decline as home price growth has slowed. Rent inflation is unfortunately the strongest in the lowest priced single family homes. Finally, we are living in a low inflationary environment compared to past decades because we live in a relatively peaceful time.
Have comments? Join the conversation on Twitter.
Disclaimer: The content on this site is for general informational and entertainment purposes only and should not be construed as financial advice. You agree that any decision you make will be based upon an independent investigation by a certified professional. Please read full disclaimer and privacy policy before reading any of our content.


