UPFINA's Mission: The pursuit of truth in finance and economics to form an unbiased view of current events in order to understand human action, its causes and effects. Read about us and our mission here.
Reading Time: 5 minutes
One of the major trends of 2018 is likely to be the acceleration of inflation growth, as we have discussed previously in the following articles:
The Fed has longed for inflation for years because it consistently has been below its goal of 2%. It’s a strange goal to have because it means the purchasing power of the consumer decreases. The theory, from the perspective of the Federal Reserve, is that if inflation is increasing it means demand for scarce good is improving thus indicating that the economy is strong. The key determining factor for the economy is how the fiscal stimulus, which is the Trump tax cut and spending increases affects the labor market. Is there any slack left in the labor market after an 8.5 year expansion? If the economy is at full employment this tax cut could cause a sharp increase in wage growth which would hurt corporate profit margins and boost inflation. The low unemployment rate supports this notion. If there is still slack in the labor market, as supported by the labor participation rate and the underemployment rate, then wage growth would increase modestly as the economy accelerates.
Inflation is a tricky thing to track because there are so many metrics that calculate it. The two most common measures are the CPI and PCE. The Fed likes to look at the core inflation for both of those measures. Core inflation is when the measurement ignores changes in food and energy prices. The Fed leans towards looking at the core PCE. That’s an important distinction because the core PCE has been much lower than the core CPI. If the Fed thinks inflation is low, then it will be more accomodative in monetary policy which means lower rates and a bigger balance sheet. The chart below shows the historical changes in the core CPI and core PCE. As you can see, the gap between the two has increased steadily.
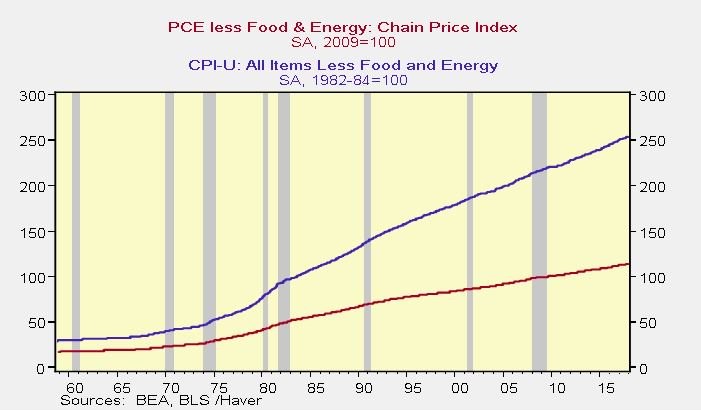
Core CPI Is Usually Higher Than Core PCE
Inflation Increases In January
The latest CPI report showed month over month inflation was up 0.5%. The annualized inflation was 2.1%. Core inflation was up 0.3% month over month and the annualized result was 1.8%. On this measurement, the Fed’s target wasn’t hit. Even though the goal wasn’t reached, it got market participants talking about the economy entering a new period of inflation. The data points which have the most impact on the market are the ones which confirm a pre-existing concern. You would think a completely unexpected report would cause the market to react, but often the reports which are completely out of line are dismissed because of weather effects or simply volatility in the report. We’re not saying expectations aren’t important. They are critical. The month over month CPI and core CPI beat expectations by 0.2% and 0.1% respectively. This report came into focus because the trend the market had expected would develop, got stronger.
Was Yellen Right About Inflation In 2017?
As we mentioned, the core PCE hasn’t hit the Fed’s 2% target in a while. The February report comes out on March 1st. The latest reading from December shows core PCE is at 1.5%. In this entire business cycle, the core PCE has only been above 2% for 4 months. Using this metric, the last time inflation was this consistently low was the 1960s. If you look at the CPI report, Yellen was right that inflation decelerating in 2017 was transitory. If you look at the PCE report, the jury is still out on if she was correct. Clearly the Fed doesn’t only look at the core PCE to measure policy because the Fed had rates at 0% in 2012 when core PCE briefly was above 2%. The Fed has hiked rates 5 times while the core PCE was below the target.
Median Consumer Prices Spiking
The Fed looks at all reputable inflation data. It seems likely Powell will have a similar practice. We’ll get confirmation when he gives his first press conference. One data point which gives those worrying about inflation cause for concern is the median consumer price index. As the chart below shows, the median CPI increased 4.15% which was the highest level since February 2007. As you can tell, this metric is highly volatile which means a few more reports are needed which confirm inflation is increasing to establish a trend. It’s this type of result which makes some analysts think the Fed will raise rates 4 times in 2018. If the Fed raises rates 100 basis points, the Fed funds rate would be at 2.25-2.5%. However if that fed funds rate increases while headline inflation doesn’t increase, the Fed would be hawkish (restrictive monetary policy) for the first time in over 10 years.
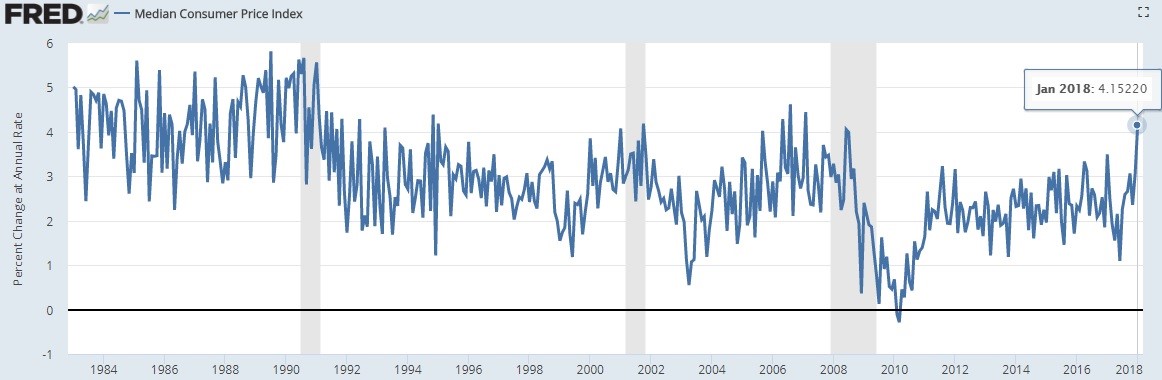
Median Consumer Price Index Spiked In January
Global Inflation Summary
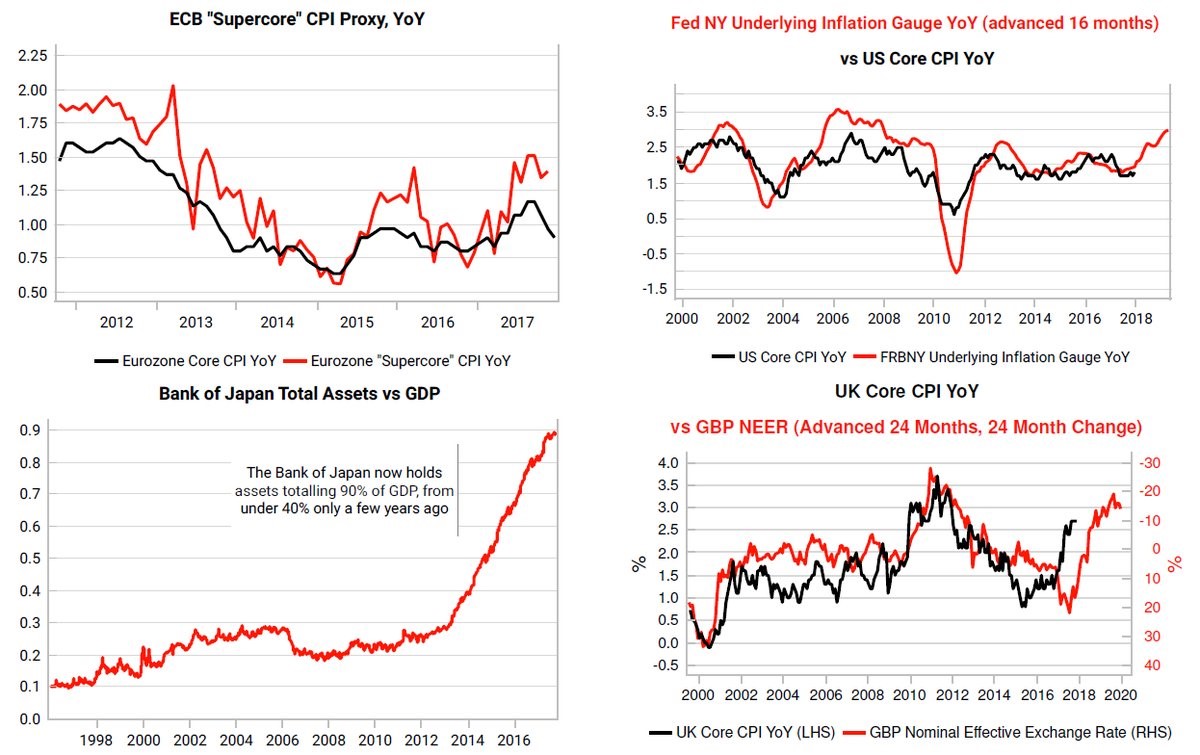
One of the best forecasters for the core CPI is the NY Fed underlying inflation index. As you can see from the chart below on the top left, the gauge expects inflation to pick up. Specifically, the index estimates CPI inflation will be between 2.2% and 3.0%. If that’s true the Fed will probably raise rates; it also wouldn’t be considered hawkish after those hikes.
Global Inflation Review
The chart on the top right shows core CPI in Europe is decelerating. This is while the ECB is in the process of tapering QE, meaning the ECB isn’t reacting to the recent reports. The red line shows the super core CPI. This is an internal term which measures 1/3rd of the items in core inflation which correlate to the output gap. When the economy is operating above potential the rate goes up and it goes down when the economy is operating below potential.
The bottom left chart shows the Bank of Japan’s total assets to GDP. This accelerated increase has led the balance sheet to become almost as large as the entire Japanese economy. Officials are worried about how the BOJ’s index buying policy is impacting productivity, so the BOJ might taper asset purchases along with the ECB. The chart on the bottom right shows the British nominal effective exchange rate implies UK core CPI will increase to above 3%.
Conclusion
Accelerating inflation is one of the biggest economic trend in 2018. The CPI and PCE reports this year are as important as the unemployment reports were in 2008-2010. Economists watched the unemployment rate rise in the recession and then fall afterwards. This phase change is what the economy might experience in 2018 as inflation goes from mild to above the Fed’s target. If the Fed raises rates quickly, will it finally cause stocks to enter a bear market? High inflation causes recessions however the choices that the Federal Reserve has in restricting inflation may be minimal, as that would negatively impact an extremely levered economy. This dilemma that the Federal Reserve is in from a policy standpoint practically guarantees higher inflation for longer. Whether higher inflation is beginning to start in 2018, in large part due to the fiscal stimulus, or in a few years from now is not enough time for the economy to grow its way out of the problem without being forced into a recession.
Subscribe to our free newsletter on upfina.com, we’ll continue to follow this story and provide you with updates after new information is released.
Have comments? Join the conversation on Twitter.
Disclaimer: The content on this site is for general informational and entertainment purposes only and should not be construed as financial advice. You agree that any decision you make will be based upon an independent investigation by a certified professional. Please read full disclaimer and privacy policy before reading any of our content.


