UPFINA's Mission: The pursuit of truth in finance and economics to form an unbiased view of current events in order to understand human action, its causes and effects. Read about us and our mission here.
Reading Time: 5 minutes
Despite significant controversy surrounding the trade war between the US and China, which the WSJ recently pointed out that China was the first to start, the economy will barely be affected by the recently announced tariffs. Currently, based on speculation and rhetoric, the trend appears to be towards negotiation rather than an outright trade war. Since it’s in no country’s interest to cease trading, it doesn’t look like that will occur. This is a geopolitical chess match rather than a war. The headlines and rumors of tariffs can spook the market in the short term, but over the medium term there’s no reason to expect major economic implications, unless sides do not reach compromises. When the stock market is at its all-time high it can be reasonable to sell first and ask questions later, but thus far there’s no reason to panic despite the modest correction already experienced.
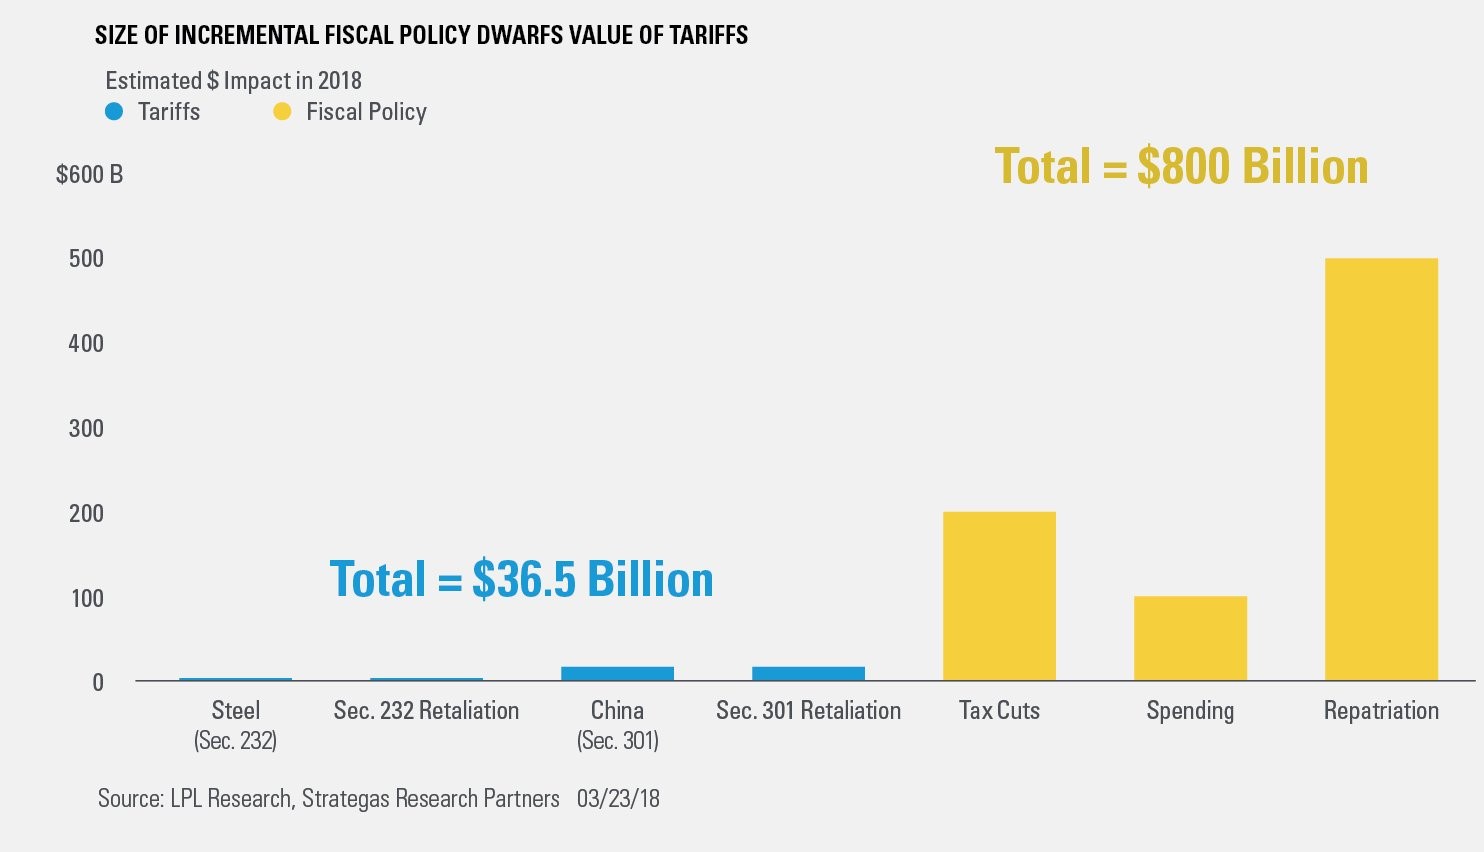
The chart below compares the fiscal stimulus to the tariffs.
The fiscal policy effect is over 20 times that of tariffs assuming no more are announced. Stories of a potential trade war have largely been aimed at generating attention rather than explaining a serious crisis.
Coordinated Economic Slowing
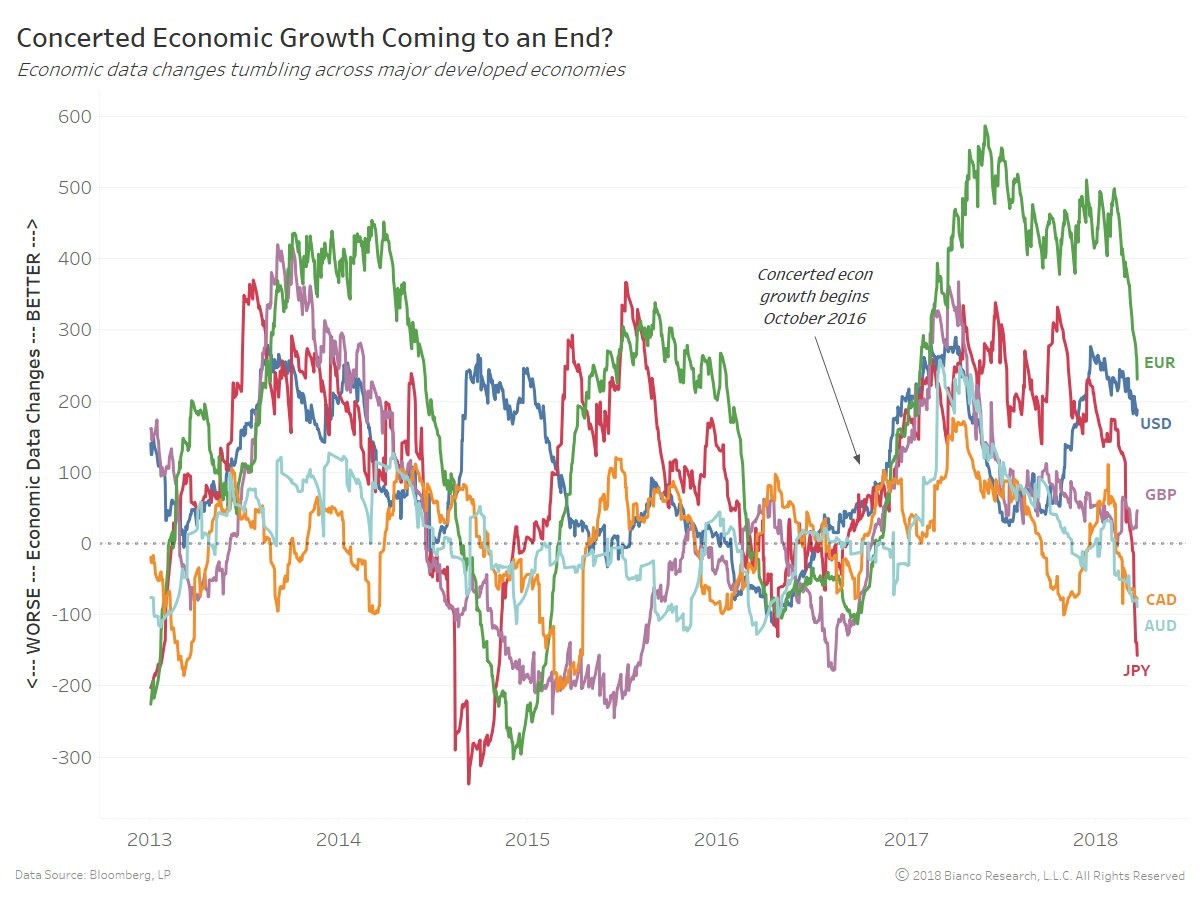
The theme of 2017 was synchronized global economic growth. It’s silly to expect a cyclical economy which rarely stays consistent to remain on a strong growth pattern indefinitely, as we have previously discussed. Interestingly, when the U.S. stock market was hitting new record highs in January, the global economy was already decelerating. Some theorists believe in the efficient market hypothesis which is that the future results are always properly discounted in an asset. It means you can’t make a profit by doing analysis because everything is instantly priced in. That doesn’t seem to be plausible in this scenario as stocks dropped after growth slowed down. It’s tough to repeat this analysis and beat the benchmark, but the possibilities are certainly in the market to make money. As you can see from the chart below, the economic data is either getting worse or less good for the developed markets. Japan and Europe have recently seen the biggest negative shift.
Therefore, while tariffs shouldn’t be a reason to sell stocks, the global economic weakness means there isn’t a reason to buy them. The media coverage on the tariffs far exceeds the coverage on economic weakness because cyclical phase changes are less interesting than a high stakes negotiation which determines the fate of the world’s two biggest economies. The reality is it would have been a bigger story if coordinated growth would have continued for another year. Economic weakness in some areas is a return to normalcy just like the increased volatility in the U.S. stock market.
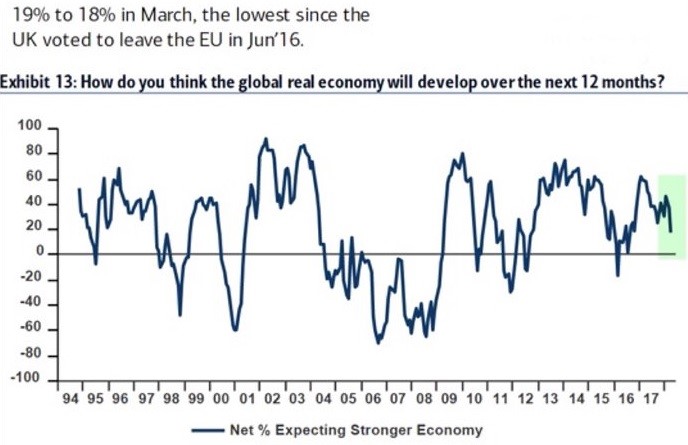
The chart below shows a fund manager survey from March which asks respondents how they think the global real economy will develop in the next 12 months.
There has been a sharp decline in the recent surveys as growth expectations are the lowest since the U.K. decided to leave the Eurozone in June 2016. That’s when the latest round of synchronized growth started gaining momentum.
Cyclical Weakness In Japan
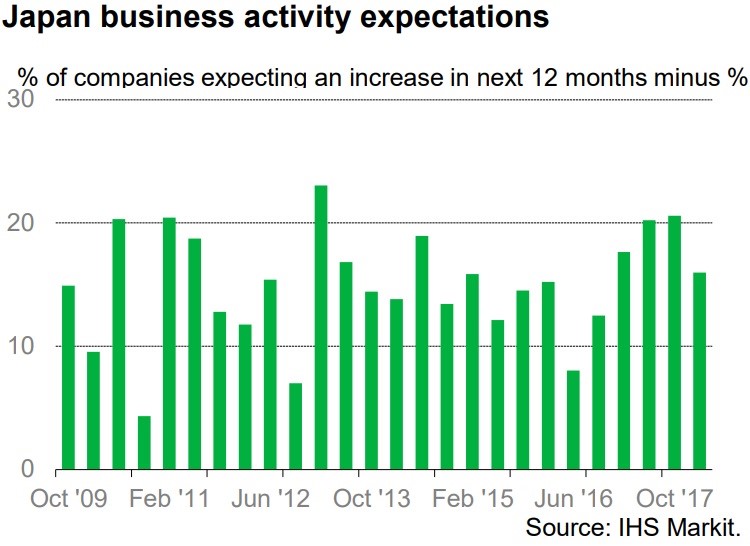
In the Markit survey taken in late February, Japanese businesses expressed the lowest optimism since October 2016. As you can see from the chart below, there are noticeable trends in the surveys with a few reports which appear random.
With such strength in late 2017, it’s not surprising to see weakness again. The net percentage of firms expressing optimism fell from 21% in October 2017 to 16% in February 2018 putting Japan near the bottom of global rankings. The negatives include capacity constraints and a lack of skilled labor. The labor market is tight so the increased retirements because of the aging population exacerbates the problem.
Cyclical Weakness In Europe
As you can see from the chart below, Europe is experiencing similar weakness to Japan in its latest Markit survey.
The survey was done in mid-March, so it’s more up to date. The flash composite index hit a 14 month low which was 55.3. The services PMI index hit a 5 month low at 55.0 and the manufacturing index hit a 14 month low at 56.1. January’s PMI was the highest since June 2006, showing that this index didn’t follow the exact trajectory shown in the chart we reviewed earlier in this article. The first quarter average PMI suggests 0.7% to 0.8% GDP growth.
The euro has been rallying versus the dollar since late 2016. The strength in the euro appears to be hurting European exports. One other point worth noting is that the ECB’s QE program is nearing its end. There doesn’t seem to be a clear cut effect on the overall economy, but it’s still interesting to see if the ECB decides to follow through on ending the asset purchases if the economy is weak. Furthermore, rate hikes will likely be shelved for however long this mild economic weakness lasts.
U.S. Bond Market Reacting To Slow Growth
Although U.S. tech stocks are getting headlines for their weakness, they’re not the only asset moving in the ‘risk off’ direction. The long bond is rallying as the 10 year treasury yield fell from its peak at 2.95% to 2.76%. The worries we discussed about the 10 year yield hitting 3% and ‘all hell breaking loose’ have been shelved. Our point still stands that higher yields wouldn’t necessarily be a problem as we detailed in The Most Important Chart In Macroeconomics. However, the new problem is lowering growth expectations causing yields to fall. The Fed is severely flattening the curve by raising rates, which pushes up short term treasury yields, while long term rates fall because of weak economic growth. The difference between the 10 year yield and the 2 year yield is 49 basis points which means the yield curve is the flattest in this business cycle. This isn’t a warning sign of an imminent recession yet, but it shows the bond market is concerned about the Fed hiking rates four times in 2018.
Have comments? Join the conversation on Twitter.
Disclaimer: The content on this site is for general informational and entertainment purposes only and should not be construed as financial advice. You agree that any decision you make will be based upon an independent investigation by a certified professional. Please read full disclaimer and privacy policy before reading any of our content.


