UPFINA's Mission: The pursuit of truth in finance and economics to form an unbiased view of current events in order to understand human action, its causes and effects. Read about us and our mission here.
Reading Time: 5 minutes
Price inflation is one of the most important economic metrics as it affects the purchasing power of the consumer, monetary policy, and asset valuations. Those who quibble with which metric is the most important try to determine which one is the catalyst for others. That’s like asking whether the chicken or the egg came first. Whether inflation drives markets or markets drive inflation, knowing where it will go in the future tells you a lot about the health of the economy. The expectation is for price inflation to increase in 2018 causing the Fed to hike rates 75 basis points. We’ve already seen the breakeven inflation rate and the CPI report from December show momentum.
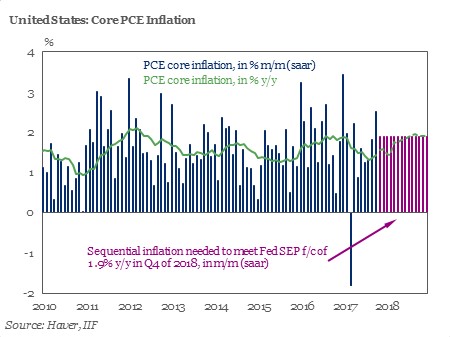
The chart below shows the historical core PCE inflation.
The Fed’s inflation goal is 2%. The core CPI usually runs a bit higher than the core PCE. This means there’s a lot more room to run if the Fed focuses more on the core PCE. The chart also shows the year over year and month over month increases necessary for the Fed’s goal to be met. It would be near the biggest boost in inflation this cycle.
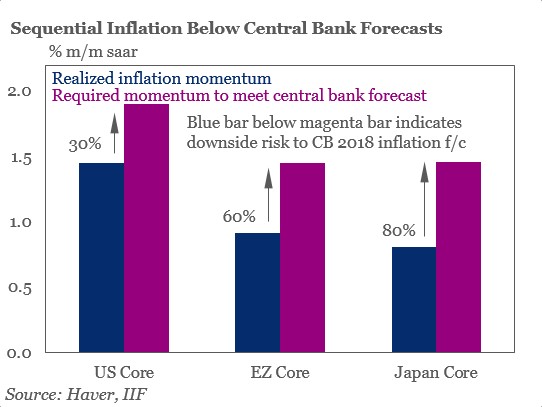
The Institute of International Finance is predicting inflation won’t meet the bold targets. 2017 started out just like 2018 is starting, but inflation growth quickly decelerated. The differences between this year and last year are oil prices are higher and rallying, emerging markets are growing, and the labor market is even tighter, not the mention the late cycle fiscal stimulus. Obviously, oil isn’t part of the core inflation, but it’s relevant because the headline inflation was also weak in 2017. The reason we mention the IIF’s forecast is because they made the first two charts we’re showing. As you can see from the one below, the sequential momentum in inflation needs to increase rapidly to meet central bank expectations.
It’s not the best idea to look at the inflation rate in terms of percentages. Core inflation varies rapidly on a percentage basis. A 1% increase in inflation starting at 1% has about the same price change as when it starts off at 3%. However, we do recognize that sustainable price inflation, as measured by core PCE and CPI, has been difficult to achieve this cycle.
Inflation Is Distributed Differently Across US
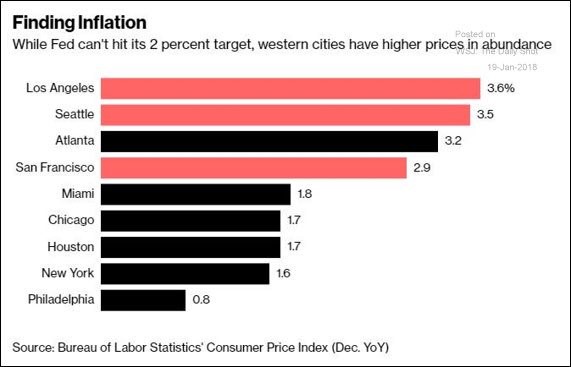
While international agencies don’t see inflation by looking at top down indicators, when you zoom in on individual cities, some inflation appears. As you can see from the chart below, west coast cities like Los Angeles and Seattle have much higher inflation than east coast cities like New York and Philadelphia.
This is the problem with the Fed setting policy for the whole country. It’s the same problem the ECB faces as Italy’s monetary policy needs are often the opposite of what Germany needs. The inflation within cities is often overlooked, but it hurts quality of life. The Fed currently has dovish monetary policy, despite the tapering and balance sheet unwind, which hurts the areas dealing with high inflation. Some of the cities with high inflation like Seattle are seeing property prices increase quickly. The ironic part about this situation is that Amazon’s growth is supporting high property prices in Seattle, but the ‘Amazon effect’ is causing overall inflation to decrease throughout the country through a low prices approach that forces competition to be price competitive.
The goal of policy should be to have low prices for consumer goods and high wages, but often high inflation gets conflated with economic growth. This implies higher prices for consumers is somehow a good thing. Capitalism is inherently deflationary because as technology advances and competition increases, prices decline and quality increases. While demand for commodities increases, the technological advancements in harvesting them reduces extraction costs in the long-term. The tech sector is relatively free compared to other industries which has allowed for price declines to be passed down to the consumer. Regulated industries often see price increases because the costs are pushed up by the government. The government wants some sort of minimum product spec to be met instead of letting the buyer decide what they want.
Breakeven Inflation Inversion Caused By High Oil Prices
We often discuss the latest breakeven inflation data as it is a free market determination for inflation outside of the CPI reports. It gives up to the minute data instead of monthly reports. The latest movement in the 10 year breakeven inflation rate has been higher as commodity prices have shown some momentum and the monthly CPI report showed increases in December and January.
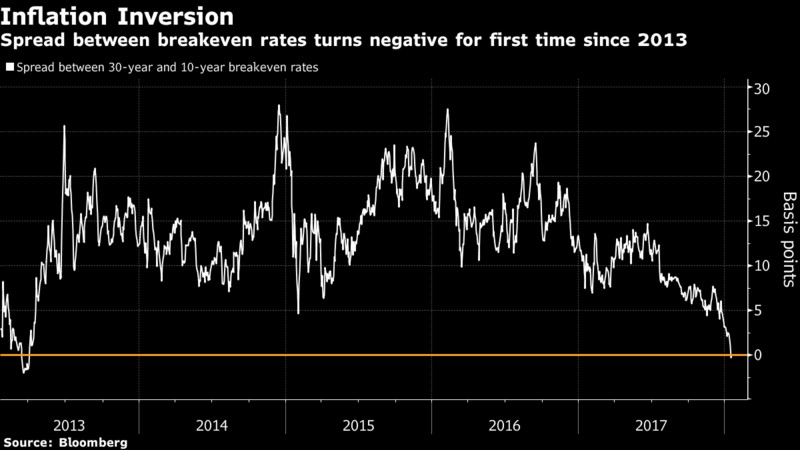
As you can see from the chart below, this has caused a somewhat unusual occurrence where the 10 year breakeven rate has risen above the 30 year breakeven rate.
This is because the commodity price inflation affects closer dated bonds. The main commodity increasing is oil which hit a 3 year high recently. There are also smaller effects from the fundamentals of the offering meaning the amount offered and its timing. Finally, the flattening of the yield curve also plays a part. The last time there was an inversion in 2013, the market steepened by about 25 basis points in the following few months. Either the 30 year breakeven will increase or the 10 year breakeven will fall. An oil price correction could catalyze a 10 year breakeven decline. How this plays out will give us further incite into where the inflation rate will end up in 2018.
The chart below gives further evidence of how oil can affect inflation stats.
The changes in oil prices had a 3 times larger impact on inflation than the trade weighted Euro. As we mentioned in the beginning of this article, the inflation isn’t necessarily the catalyst of economic changes. In this example it means, the increased demand for oil plays a part in the price increase, meaning economic growth is driving price inflation. We previously mentioned how governments are often the drivers of price inflation. In this case, the OPEC cuts are boosting prices.
Conclusion
This article showed different wrinkles in the inflation data instead of just looking at the headline and core inflation. The IIHF has an uncharacteristically contrarian prediction on inflation. It might come true, but we think the way they show the percentages is wrong at best and deceiving at worst. The market is a complex structure thereby linear thinking does not always pan out, especially in the short-term.
Have comments? Join the conversation on Twitter.
Disclaimer: The content on this site is for general informational and entertainment purposes only and should not be construed as financial advice. You agree that any decision you make will be based upon an independent investigation by a certified professional. Please read full disclaimer and privacy policy before reading any of our content.


