UPFINA's Mission: The pursuit of truth in finance and economics to form an unbiased view of current events in order to understand human action, its causes and effects. Read about us and our mission here.
Reading Time: 5 minutes
The labor market is almost full as the prime age employment to population ratio is nearing the 2007 and 1990 peaks and the underemployment rate is in between the past two cycle bottoms. Firms in many industries are complaining they can’t find qualified workers. There’s a catch to that point. They can’t find qualified workers for the wages they want to pay, but they would be able to find qualified workers if they raised salaries. Raising salaries means prices need to be raised or margins will fall. That’s a tough decision, but employers need to realize the labor market is tightening and get with the times.
The chart below shows the quit rate measuring the number of workers quitting their jobs for better opportunities, which can act as a leading indicator for the Employment Cost Index.
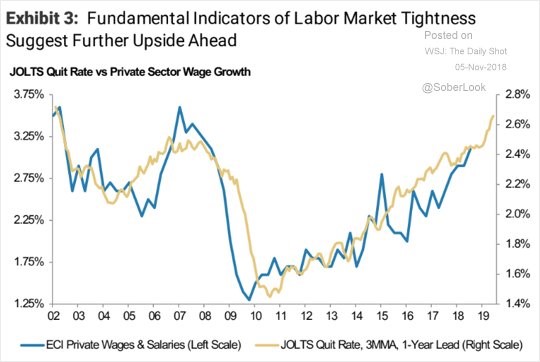
In this chart, the quit rate is ahead of the ECI by 1 year. The correlation is high in the past 16 years. It implies wage growth will continue. This isn’t a shocking proposition as a tightening labor market and decent productivity growth mean wages will increase. The areas with the highest wage growth should be jobs filled by workers without a high school diploma because that demographic has the highest employment to population ratio ever.
Wage Growth Doesn’t Mean Price Inflation
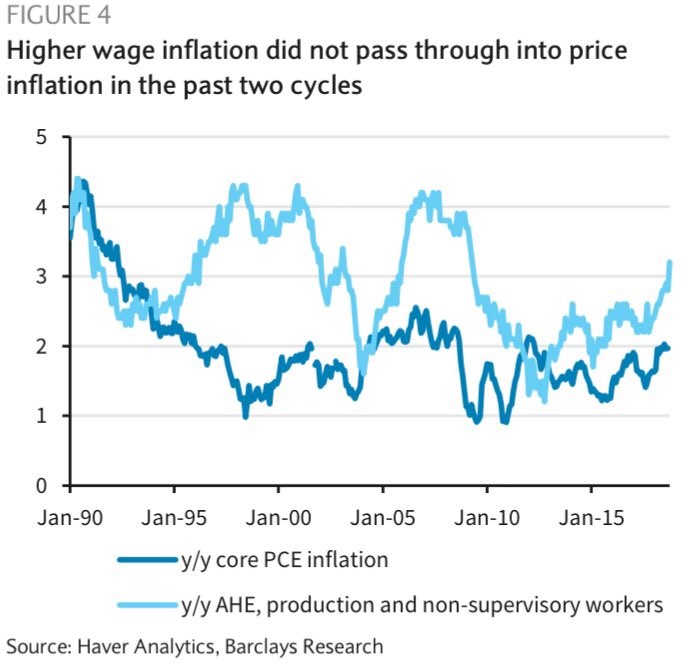
Wage growth can mean price increases for individual businesses because they need to offset increasing costs. However, when you look at the whole economy, average hourly earnings growth for production and non-supervisory workers hasn’t led to increased core PCE inflation. Commodity inflation has been weak in 2018. The Fed is hiking rates because it expects inflation to increase in 2019. It’s problematic if the Fed is increasing rates because of wage growth because the chart below shows it hasn’t pushed core PCE higher.
One catalyst of inflation could be the tariffs. The problem for the Fed is tariffs can slow the economy and increase prices. That’s a tough problem to solve. The Fed might decide to be patient and hope both sides decide to end the trade war by making a deal.
Inventory To Sales
The chart below shows the inventory to sales ratio is currently in the 50th decile which means there will be average stock returns in the next 6 months.
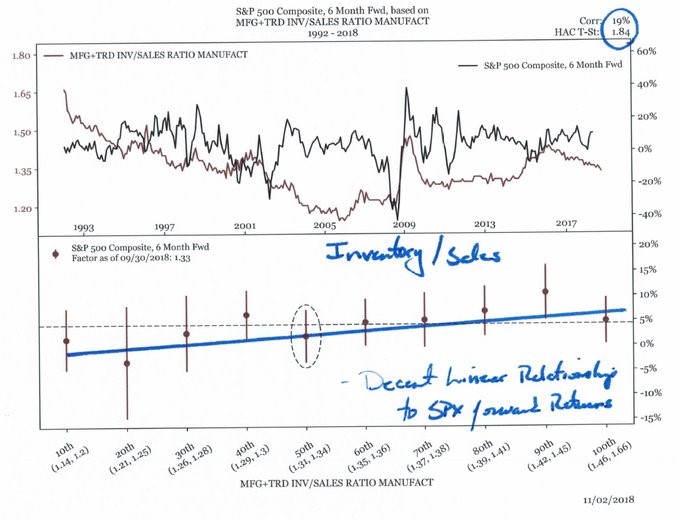
Interestingly, even though high inventories should hurt margins because the excess products need to be sold at a discount, a low inventory to sales ratio implies weak forward returns. This is similar to how a low unemployment rate is a bad sign for stocks. Too much of a good thing means the economic boom is about to end and prices are increasing. That isn’t happening since the ratio is in the 50th percentile.
Use Of Cash…
S&P 500 firms spent more on buybacks than capex in Q1 and Q2 2018. That’s the first time that occurred since right before the financial crisis. That seems like a devastating parallel, but it might not be because the influx of capital caused by the tax cut and repatriation holiday caused firms to return it to shareholders. There’s only a certain amount of capex projects that can go at once. It’s a high quality problem to have too much cash. The easiest solution is to return it to investors.
The chart below shows the information in a more disconcerting light because it’s not just 2018 showing a problem.
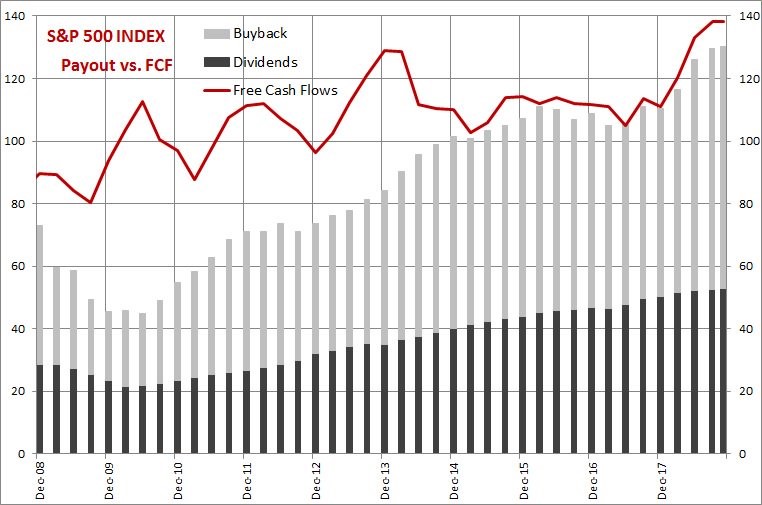
The sum of buybacks and dividends for S&P 500 firms has been taking up almost all free cash flows since 2014. The only options for firms are to have low capex relative to free cash flow, reduce buybacks, or increase leverage.
Earnings Estimates Are Falling
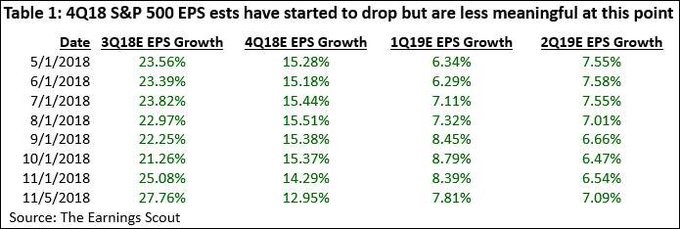
Q3 earnings season was supposed to help stocks recover from the correction. At the beginning of the year, Q3 was projected to have the quickest earnings growth, with Q4 having a steep drop off because of tougher comparisons. Q3 earnings season didn’t save stocks and the drop off in year over year growth is about to be more severe than expected. Peak earnings grow this far from peak earnings. The determining factor for how stocks do in the next year is how much estimates fall. In the past few days, the answer is a lot. The table below shows that from November 1st to November 5th Q4 estimates fell from 14.29% growth to 12.95% growth and Q1 estimates fell from 8.39% growth to 7.81% growth.
Earnings estimate revisions were a huge positive earlier in the year. The chart below shows the 3 month average was the highest going back to 1986.
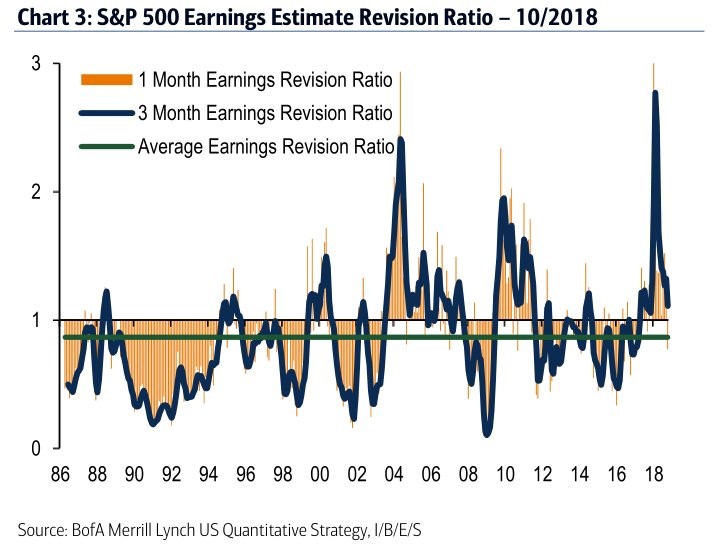
The situation has reversed very quickly as estimates for future economic growth fall. 1 month earnings revisions are negative and 3 month average estimates are close to following along. The biggest negative catalysts for the economy are the trade war, a hawkish Fed, and the stimulus losing its luster. The 0.8% Q3 business investment growth signals the stimulus may already be done helping growth.
Are Valuations The Saving Grace?
The one saving grace for stocks is they have gotten a lot cheaper in 2018. The chart below shows as of October 31st, the PE multiple compression in 2018 has been the 3rd largest in the past 40 years.
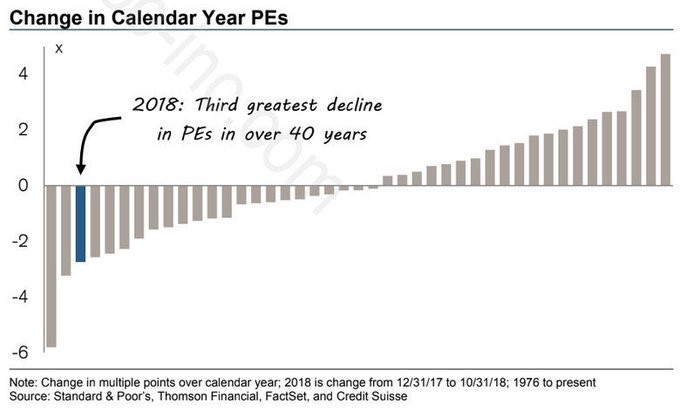
When you combine +20% earnings growth with a flat market, the multiple compresses. The problem is earnings fall in slowdowns. If those potential negative catalysts end up coming true, stocks will falter because they trade on future estimates, not trailing earnings.
Conclusion
Wage growth inflation is coming, but it may not cause core PCE inflation to spike. Even though wage growth shouldn’t cause inflation, the Fed has been hiking rates quicker as there will probably be a total of 4 hikes in 2018. A hawkish Fed, tariffs, and a waning stimulus could weaken 2019 economic growth. Q4 and Q1 earnings estimates are starting to wane quickly. Earnings revisions are no longer extremely positive. The good news is stocks shouldn’t crater if earnings grow in 2019 because they are cheap based on 2018 earnings. Earnings needs to peak for a bear market to occur. A peak in “earnings growth” isn’t a bad thing, because its not practical to assume +20% EPS growth will be maintained.
Have comments? Join the conversation on Twitter.
Disclaimer: The content on this site is for general informational and entertainment purposes only and should not be construed as financial advice. You agree that any decision you make will be based upon an independent investigation by a certified professional. Please read full disclaimer and privacy policy before reading any of our content.


