UPFINA's Mission: The pursuit of truth in finance and economics to form an unbiased view of current events in order to understand human action, its causes and effects. Read about us and our mission here.
Reading Time: 5 minutes
The same macro trends have continued into November. Rather than inventing new trends which aren’t occurring, we’ll provide more coverage on what’s affecting markets. There’s growing uncertainty over global growth, the Fed’s rate hikes, tariffs, the housing market, and the fiscal stimulus losing its impact. We’ve seen oil prices plunge nearly 20%, partially because of global demand woes. We see the Fed discussing how tariffs can hurt growth, but still planning to hike rates in December. The Fed can’t control trade policy, but it can react to the current environment just like how it became hawkish after the fiscal stimulus.
The 0.8% quarter over quarter business investment growth in Q3 implies the boost from the stimulus is abating. Even with all these negatives, the consumer is still confident because of the strong labor market and low inflation. Declining prices at the gas station can easily offset the volatility in the stock market allowing consumer spending growth to maintain its strength.
Uncertainty Increases
We mentioned some of the concerns investors have. This is bearing out in the Q4 and Q1 S&P 500 earnings estimates which are starting to fall. Q4 and Q1 growth estimates have fallen from 15.37% and 8.79% on October 1st to 12.88% and 7.74% on November 6th. The chart below quantitatively expresses the macro drivers of U.S. equities.
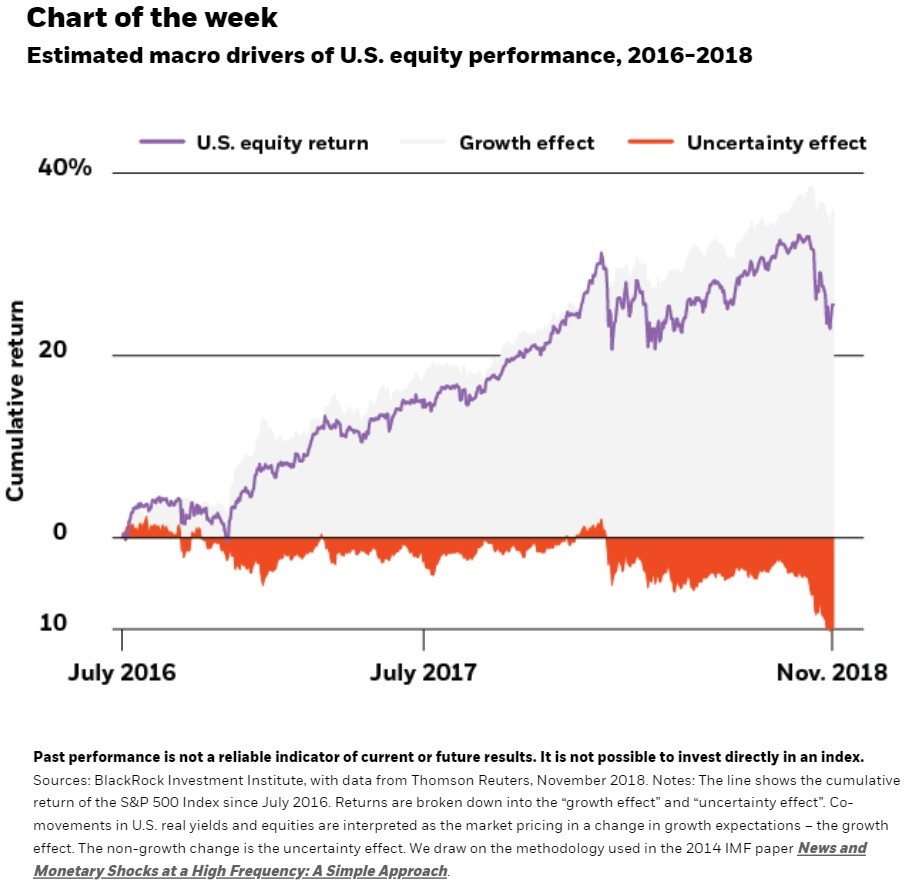
Growth is driving stocks higher, but uncertainty is driving them lower. Uncertainty is by far the highest in the last 2.5 years. The uncertainty effect can be thought of as the market pricing inthe possibility of negative catalysts. For example, if the market feels there is currently a 30% chance the trade war with China continues throughout 2019 andthat will hurt stocks by 20%, it immediately sells off by 6%. A few negativecatalysts like this can drive sharp corrections. Sentiment can be volatile, but the catalysts of uncertainty need to be solved for stocks to reach a new record high.
If you don’t believe in BlackRock’s calculation of uncertainty, you can look at the old fashion definition of uncertainty which is the relationship between the consumer staples stocks and the S&P 500. Consumer staples are slow growing stocks with consistent businesses. They are bought when investors are worried about the economy. As you can see from the top chart below, the consumer staples ETF recently hit a 9 month high.
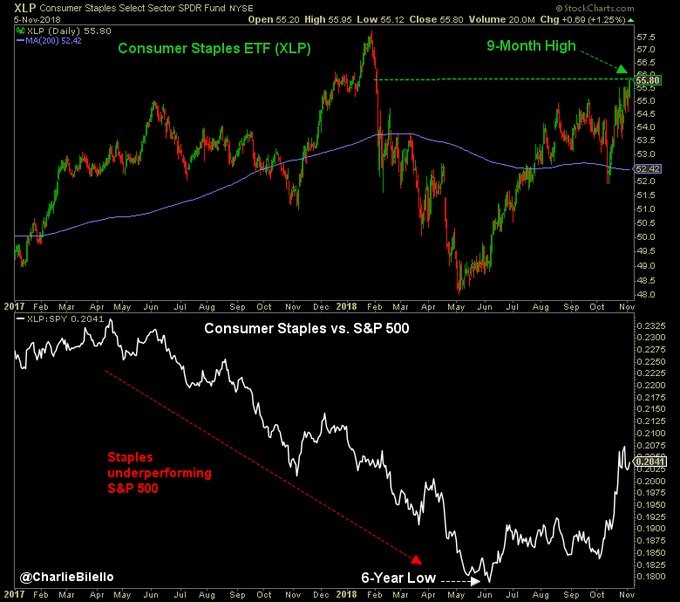
Consumer staples relative to the S&P 500 hit a 6 year low in June 2018 as the stimulus was at its peak, driving 4.2% GDP growth in Q2. Fixed investment actually helped growth in Q1 by 1.1% unlike Q3 where it hurt it by 4 basis points. Consumer staples versus the S&P 500 have been rallying with high outperformance during the October correction. That’s different from the January-February correction.
Zillow Gives Us The Latest On Housing
The most recent data on the housing market comes from Zillow’s Q3 report. Sometimes individual company or specific sector performance can muddy the water on how the overall economy is performing, but it’s still worth looking at this information to get another data point. In the case of Zillow, this gives us an additional perspective on the housing market. The firm’s revenue guidance had a big miss as it expects Q4 revenues to be between $340 million and $357 million which was below estimates for $368 million. Q3 revenue of $343.09 million missed estimates for $344.19 million.
The company’s stock declined 25% on this report as investor don’t like the idea of its new home flipping business which had $11 million in revenue and $16 million in losses. It’s a bad time to be in the home flipping business as home flipping volume has been declining in the double digits for the past 3 months. Nationally it fell 18% year over year in August. The worst market was California which fell 22%. Zillow stock is falling because of its bad timing and because of the cyclical weakness in housing. It’s almost as if Zillow’s decision to get into home buying and selling marked a top for the market.
Housing Is Unaffordable
The home flipping market is weakening because it’s switching from a seller’s market to a buyer’s market. Before prices decline, volumes decline. Poor volume is bad for flipping, which heavily relies on liquidity. The catalyst of the weakness is affordability. As you can see from the chart below, it takes 23.6% of median income to make the monthly payment on the average priced home. This means housing is the least affordable in almost a decade, but by historical measure it’s not bad.
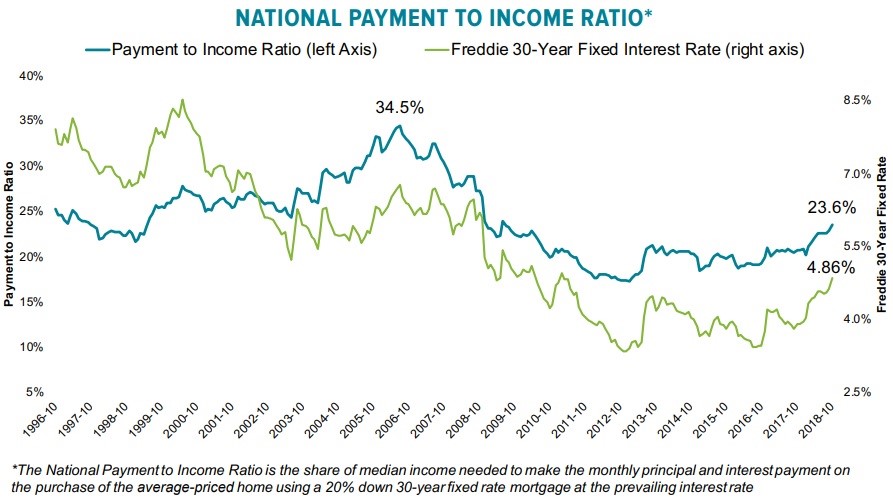
The weak consumer sentiment on housing buying conditions is spot on. Rising interest rates are part of the problem as you can see above. Prices were up 0.05% in August which is about 33% of the 25 year average in August. Monthly principal and interest payments are up $190 per month since the start of 2018 which is an 18% increase. Housing is more affordable than it was from 1995 to 2003, but that includes the run up to the housing bubble.
The map below shows the Midwest is the most affordable and California is the least affordable.
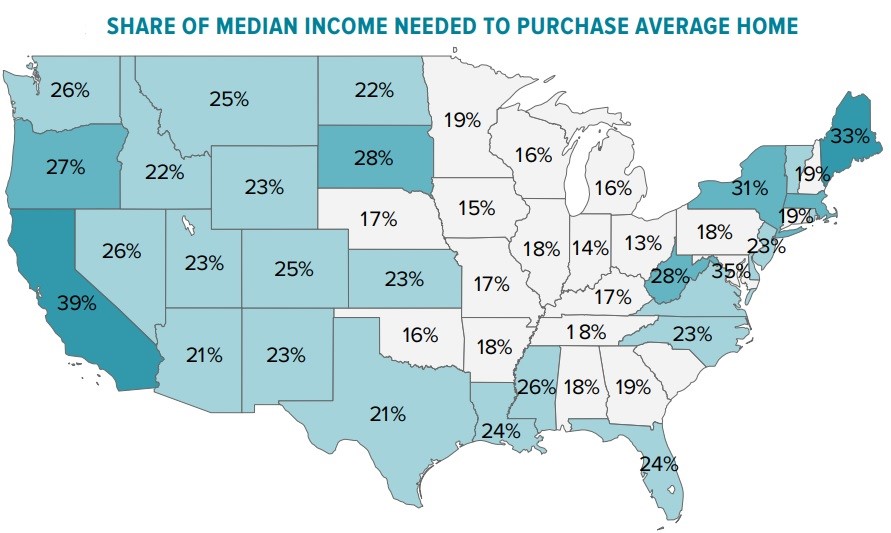
It takes 39.3% of income to make mortgage payments in California. That’s worse than the national average at the peak of the housing bubble. Amazingly California peaked at 59% in 2006. It’s average from 1995 to 2003 is 31.8%. Rising interest rates affect the national market unlike local economic trends, meaning they hurt affordability everywhere.
Consumers Still Deleveraging
As you can see from the chart below, the household debt to disposable income ratio fell from about 135 at the peak to below 100.
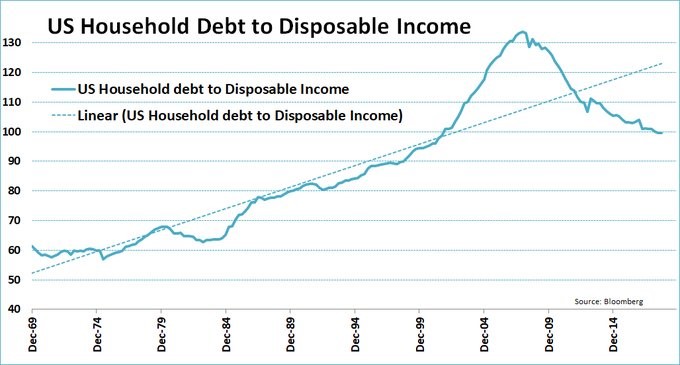
Despite the lack of affordability in housing, household debt isn’t a problem. When combined with the strong labor market and low inflation rate, it’s not a surprise to see consumer spending growth accelerating. It was up 4% in Q3. If personal consumption growth in Q3 contributed the average amount to GDP growth from Q2 2016 to Q2 2018, GDP growth would have been 2.6% instead of 3.5%. The economy is relying on the consumer more than usual.
Conclusion
If a trade deal between America and China can get done, the consumer can be relied on to drive growth in 2019. Housing price growth can moderate without falling negative if the labor market remains strong. The problem is tariffs are starting to affect consumer goods, which could slow growth and increase inflation. It’s an unforced error in a great environment where the consumer could drive this economic expansion to be longer than the one in the 1990s.
Have comments? Join the conversation on Twitter.
Disclaimer: The content on this site is for general informational and entertainment purposes only and should not be construed as financial advice. You agree that any decision you make will be based upon an independent investigation by a certified professional. Please read full disclaimer and privacy policy before reading any of our content.


