UPFINA's Mission: The pursuit of truth in finance and economics to form an unbiased view of current events in order to understand human action, its causes and effects. Read about us and our mission here.
Reading Time: 5 minutes
In this article, we’ll question the narrative that you must go overweight US stocks relative to international equities. The sentiment has shifted dramatically as investors have gone from expecting mediocre returns from US stocks along with worrying about the end of the cycle, to now expecting new record highs. To be clear, even though investors weren’t necessarily expecting a crash because the economy and earnings were strong, they were saying most of the gains for the cycle were in, which is even worse.
One year of a flat market followed by a bear market is worse than an immediate bear because it means lower long term returns. Now records are expected to continue being made because the crowd is subject to recency bias as it’s easy to claim stocks will continue what they have done because it makes those who say this look like they rode the previous wave. Plus, those who have rode the wave have a larger voice because they are confident and the media promotes who was most recently correct. The CNN Fear and Greed index is at 77 out 100 which is extreme greed; this signals intermediate term returns will probably be weak.
Sector Growth
The table below breaks down where the rally has come from this year.
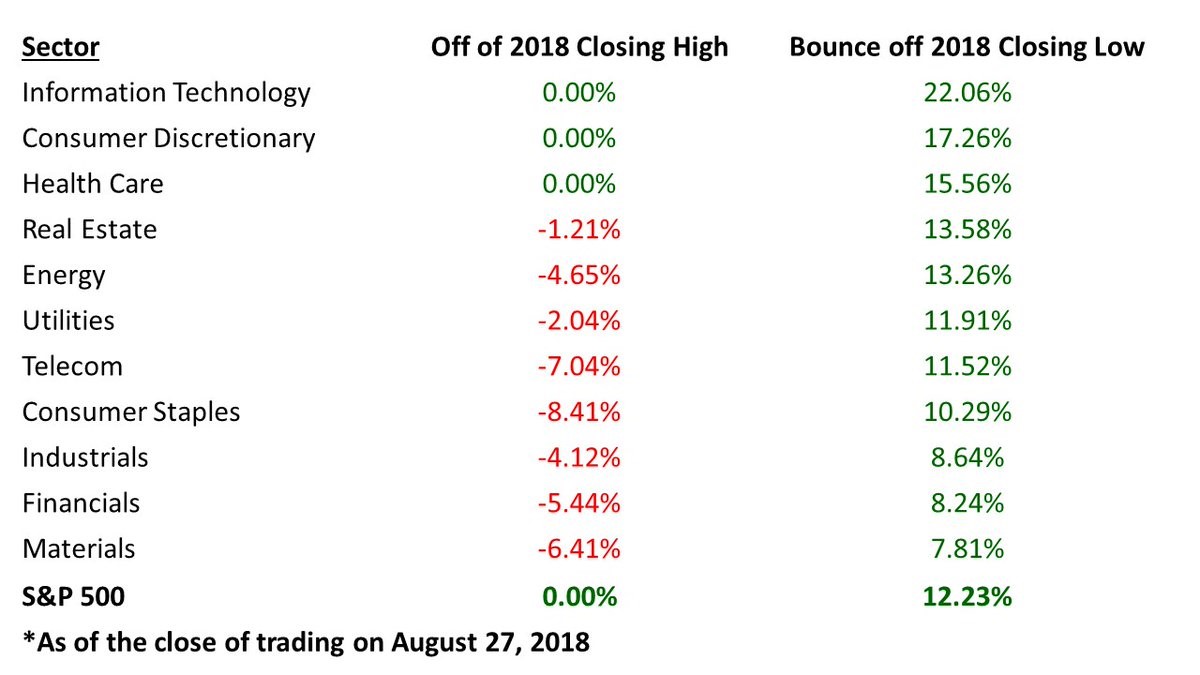
The tech sector is leading the charge as it is up 22.06% from its lows of the year. Consumer discretionary its also at a record as it is up 17.26% since its closing low. The sector is led by Amazon which had the second highest Q3 estimate revisions in the S&P 500. It’s remarkable to see the 2nd largest company in America, which is followed by numerous analysts, have its 3Q estimates increase 81.36%. However, we are not in a tech bubble like the 1990s since the internet companies are backing up the growth with record earnings.
Technically Amazon is consumer discretionary, but it’s still an internet company because most of its profits come from Amazon Web Services. Even Apple had a 16.77% increase in 3Q estimates. It’s very easy to see why stocks have rallied, but it’s difficult to see where they are going. To be clear, the fact that this rally has been justified by great earnings means the ensuing underperformance shouldn’t be that bad unless the economy sharply declines, which we don’t see happening based on the current data and leading indicators.
Earnings Momentum
In rate of change terms, when a metric increases from weak to mediocre, it’s a huge positive and when a metric declines from great to good it’s a problem. America is the latter and most of the rest of the world is the former. As you can see from the Macro Ops chart below, the US earnings momentum has fallen from the low teens to the mid-single digits.
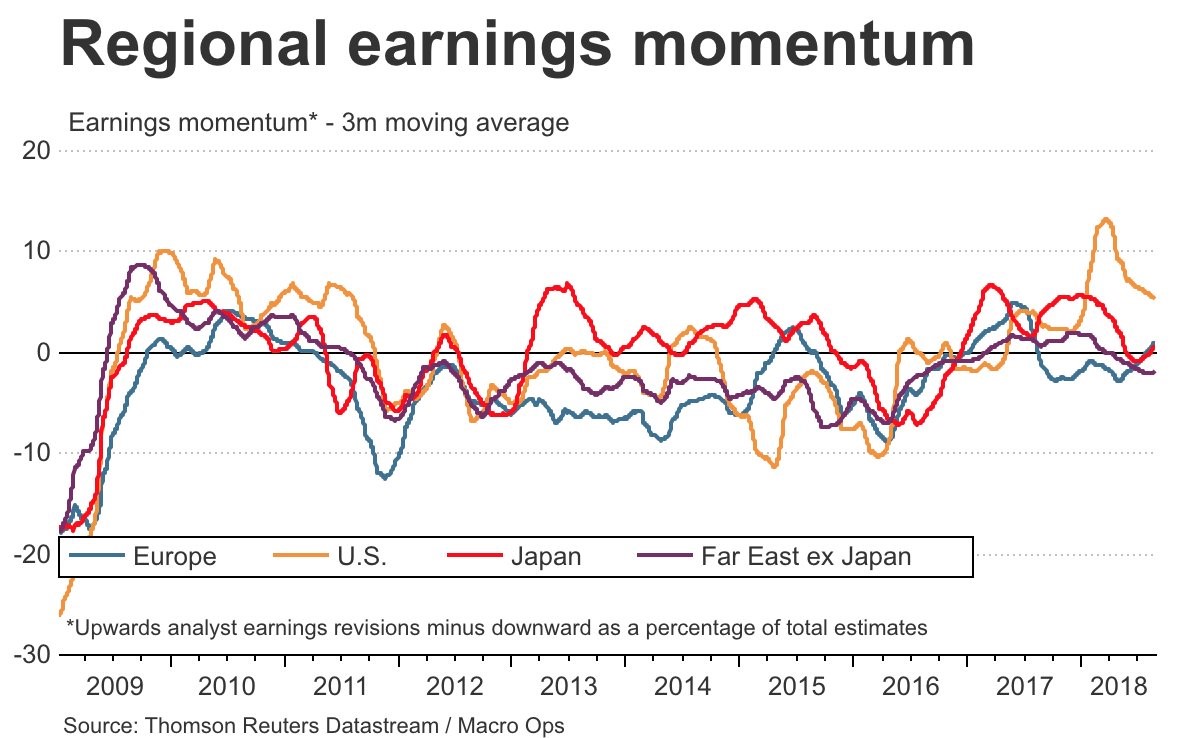
Both Europe and Japan have gone from negative to positive earnings momentum, while the far east excluding Japan remains weak. Earnings momentum is upward analyst revisions in relation to negative ones. Analyst revisions provide an updated view of where stocks should be based on their earnings. To be clear, looking at the rate of change of a momentum indicator is a not a precise way to look at earnings, so this could be wrong.
Economic Surprise Indicators
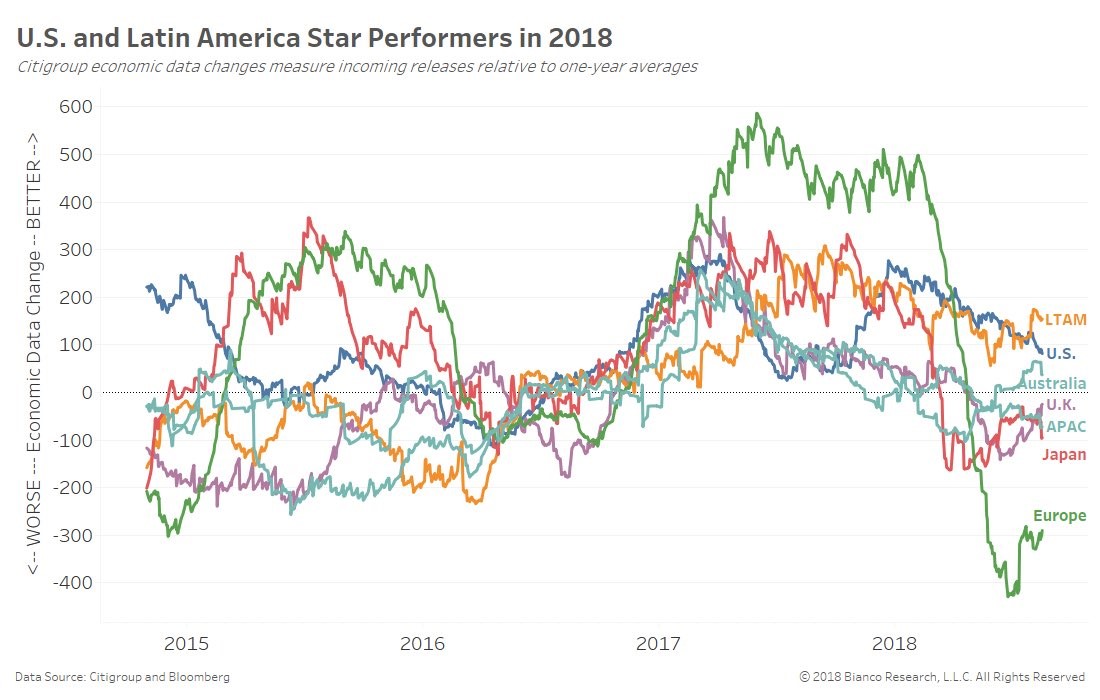
The US Citi Surprise index is -19.2 as the economic data has missed estimates. It’s the worst situation when growth is expected to be strong and it comes in tepid. Weakness isn’t priced in. The chart reviews data changes in relation to the one year average. As you can see, America has gone from the best performer in early 2018, to close to the flat line. Europe, on the other hand, went from extremely negative to slightly less bad.
S&P 500 Earnings
The table below shows the historical changes to Q2, Q3, Q4, and Q1 2019 S&P 500 earnings estimates.

The strong results in Q2 and the optimistic estimates in Q3 explain why stocks have done so well this year. Now we must look at Q4 estimates to see where stocks are headed for the next 3 months. The estimates are lower than the previous quarters because the comparisons are tougher, but that’s irrelevant because we knew this growth drop off would occur after the Q4 2017 results came out and the tax cuts were passed. Q4 estimates rose earlier in the year, but now have flatlined.
Stocks Are Expensive
The CNN Fear and Greed index agrees with earnings estimates in relation to stock prices shown in the chart below as both indicators tell investors they should be cautious.
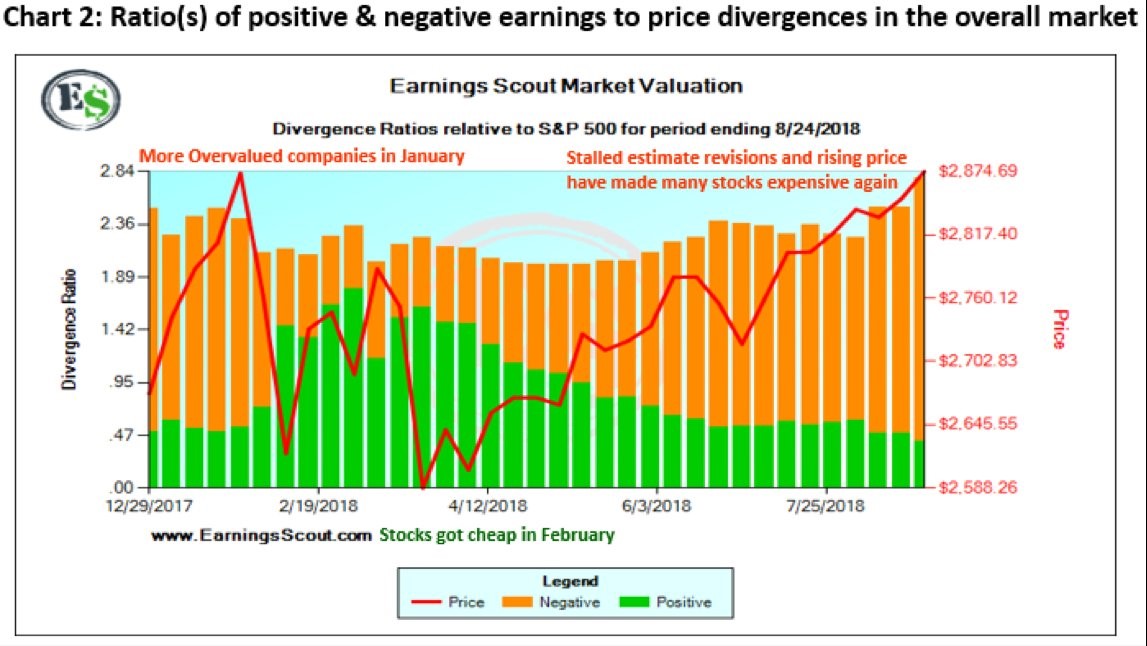
The S&P 500 has rallied on top of negative earnings revisions just like in January when it hit a medium term peak. It was a great time to buy stocks at the troughs in February and March as earnings revisions were more positive than negative.
Buybacks Can’t Save Stocks
Stock buybacks don’t drive equity returns. They only go up and down with stocks because they are correlated with profits. Stock buybacks are much more sensitive than dividends because firms are cautious about dividends because they want to maintain payment streaks, streaks without a cut, and streaks where the dividend is raised. The chart below shows the firms with the biggest buybacks have been underperforming the overall market in the past few years.
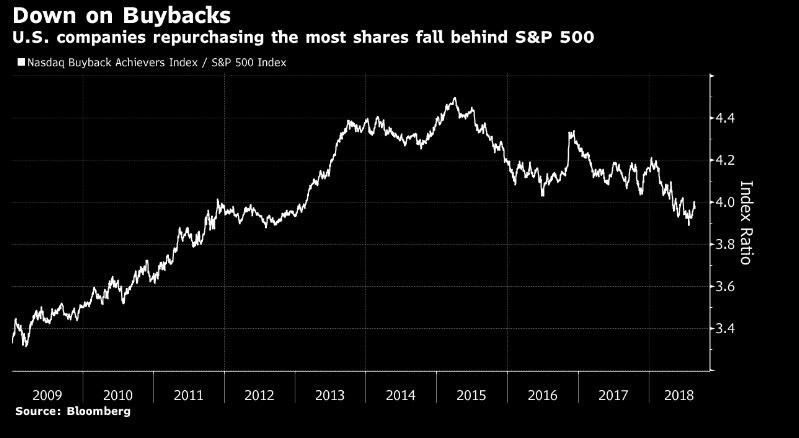
If buybacks are manipulating stocks higher, they aren’t doing a good job. Buybacks are at a record high in 2018, yet underperformance has continued, destroying the argument that buybacks determine stock prices. They have a small impact on stocks.
Conclusion
This isn’t a complete argument as to why you should go underweight US stocks, but it gives you enough information to make you want to do further research as to why you should exit the long U.S. trade and go overweight international equities. Some traders say buying international markets is just a short dollar trade. However, that doesn’t mean the trade doesn’t price in the relative performance of economies. If U.S. growth lags, American stocks will underperform. America had its time in the sun after the tax cuts and strong Q2 GDP growth, but that sunshine is slowly fading.
Have comments? Join the conversation on Twitter.
Disclaimer: The content on this site is for general informational and entertainment purposes only and should not be construed as financial advice. You agree that any decision you make will be based upon an independent investigation by a certified professional. Please read full disclaimer and privacy policy before reading any of our content.


