UPFINA's Mission: The pursuit of truth in finance and economics to form an unbiased view of current events in order to understand human action, its causes and effects. Read about us and our mission here.
Reading Time: 5 minutes
In this article, we’ll review the factors which are moving stocks prices and explain why valuations are where they are. The important concept to understand is that the explanation for why a metric is at a certain level, doesn’t imply that the metric will continue its trend. You must understand why the situation has come to fruition to see how it will end. For example, it’s fine to be bearish on Tesla because it hasn’t reached profitability. However, this won’t get you anywhere when the stock goes up after reporting another quarter of losses. You can’t be myopic. You must understand why investors are buying Tesla stock in the first place to understand what might make this type of crowd go the other way and sell. There’s investor hope on how the Model 3 will do. Until the results for the Model 3 come out, there’s no reason to focus on profitability as a catalyst for the stock. Even if Tesla were to run out of cash, it can easily raise money if investors still believe the hype surrounding the Model 3.
It’s a similar situation for the U.S. stock market. You can sell stocks because you have valuation concerns if you want, but you can’t expect this to act as a catalyst for stocks to sell off. We’ll go over why stocks have been doing so well lately, but let’s first look at the valuations which were mentioned. As you can see from the chart below, the 10-year annualized returns have a 99% chance of being in the single digits or lower based on current valuations according to Goldman Sachs. Goldman is using the Shiller PE to value stocks. The Shiller PE is the 10-year inflation adjusted earnings multiple which adjusts for margin changes. It’s interesting to see the edge of the chart including positive returns. It shows that there’s no guarantees in forecasts. The opportunity costs are lower when stocks get expensive, but stocks aren’t a lock to go lower. Anyone showing you a chart which seems to guarantee the direction of an asset is manipulating readers. The key is to look at the probability of your thesis being incorrect.

Anticipated S&P 500 10 Year Annualized Returns
The chart which shows extreme valuations is the price to sales ratio shown below. This a basic calculation which looks at the amount of sales you get when you buy stocks at present valuations. We’re nearly at the levels seen in the most expensive market ever in the early 2000s which was created by the hype surrounding tech stocks. The relative valuations of each sector aren’t out of the historical norm which means most sectors are participating in this bubble. The reason why stocks are doing well is because of the expansion of buybacks, increased large cap profit margins, the prevalence of ETFs, the baby boom generation reaching their peak wealth, low interest rates, and global quantitative easing.
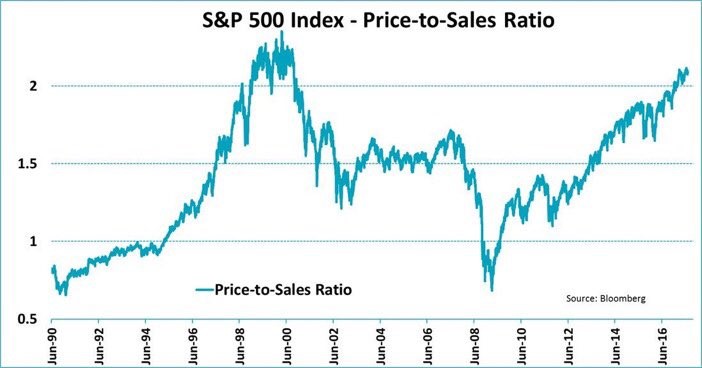
The S&P 500 Price To Sales Ratio Is Near A Record High
The two factors we will focus on in this article are profit margins and buybacks. High profit margins are why earnings valuations aren’t as expensive as sales valuations. Operating margins are expected to be 10.18% in Q2 2017 (with half of the firms reporting earnings) which is a record high. That’s 8 basis points higher than the peak in Q3 2014. Buybacks are the biggest source of demand for stocks even though they fell after the earnings recession in 2015-2016. Buybacks will increase if a repatriation tax holiday is announced as the tax rate to bring the corporate profits back to the US will be temporarily lowered. During the last repatriation holiday, much of the money was spent on buybacks. This could be a catalyst for pushing stocks higher in 2018 if you pay attention to money flows instead of valuations which rarely affect the short-term price action.
The answer to why profit margins are so high and buybacks have increased to become the main driver of stock action is the decline in competition in the US over the past few decades. The less competition, the less money firms must invest in new products which means they have more capital to fund buybacks. Capitalism is a system which has creative destruction, benefiting the the consumer with lower prices and better quality. Profits fall to zero when there’s perfect competition. That means less competition will improve margins. The opposite is a monopoly which has high prices and no incentive to improve quality. We looked at the competition for sales, but there’s also competition for acquiring skilled labor. If there are fewer companies, it limits the options workers have which suppresses wage growth.
The chart below summarizes the decline in competition which is likely caused by regulations which limit small business growth. Another factor is the increasing market values of large caps fueled by cheap debt that’s forcing small business either out of business or to be acquired.
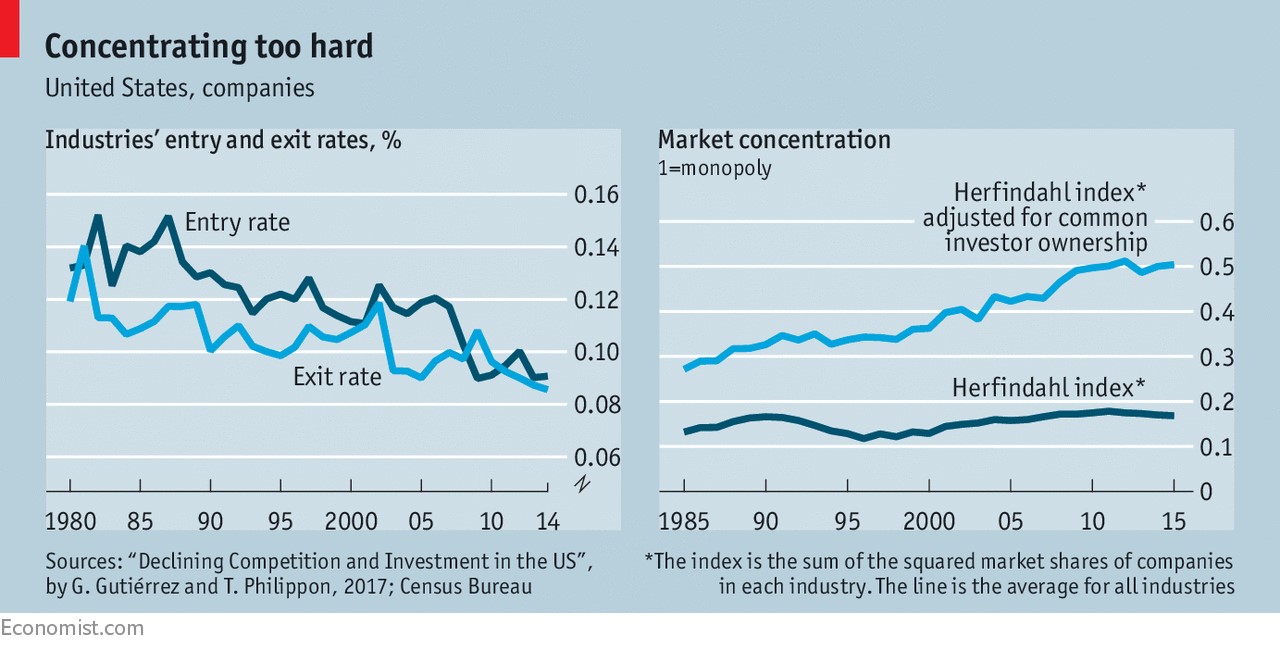
Lack Of Competition
A huge misnomer is that big corporations don’t want regulations because they hurt profit growth. While adhering to regulations costs large firms money, that money is saved in the end because regulations prevent new companies from sprouting and competing with the large ones. The chart on the left shows the entry and exit rates of new businesses into industries. As you can see, the percentage of new companies coming into the market place and leaving it are slowing. This shows the market isn’t close to perfect competition. The chart on the right shows the market concentration increasing over the past few decades. A monopoly in itself isn’t necessarily bad in a free market because it means one firm is satisfying customers the best. The problem is when the government regulations, through patents and otherwise artificially create monopolies. That allows companies to become cash cow dinosaurs as they decrease investment into the business, increase prices and ignore customer satisfaction. In the case of the US many industries have turned into oligopolies, such as internet providers, utilities, and many tech companies.
The infographic below gives you everything you need to know about the regulation increases over the past several decades. As you can see from the second chart, the total pages of regulations is up nearly 160% from 1975 to 2016. The chart on the top calculates the number of major rules implemented. As you can see, regulations usually increase near recessions because politicians want to make sure the problems don’t repeat. The regulations under Obama spiked without an official recession, though growth has been tepid at best. This hurts productivity and competition, while it improves profit margins and stock prices of the largest firms.
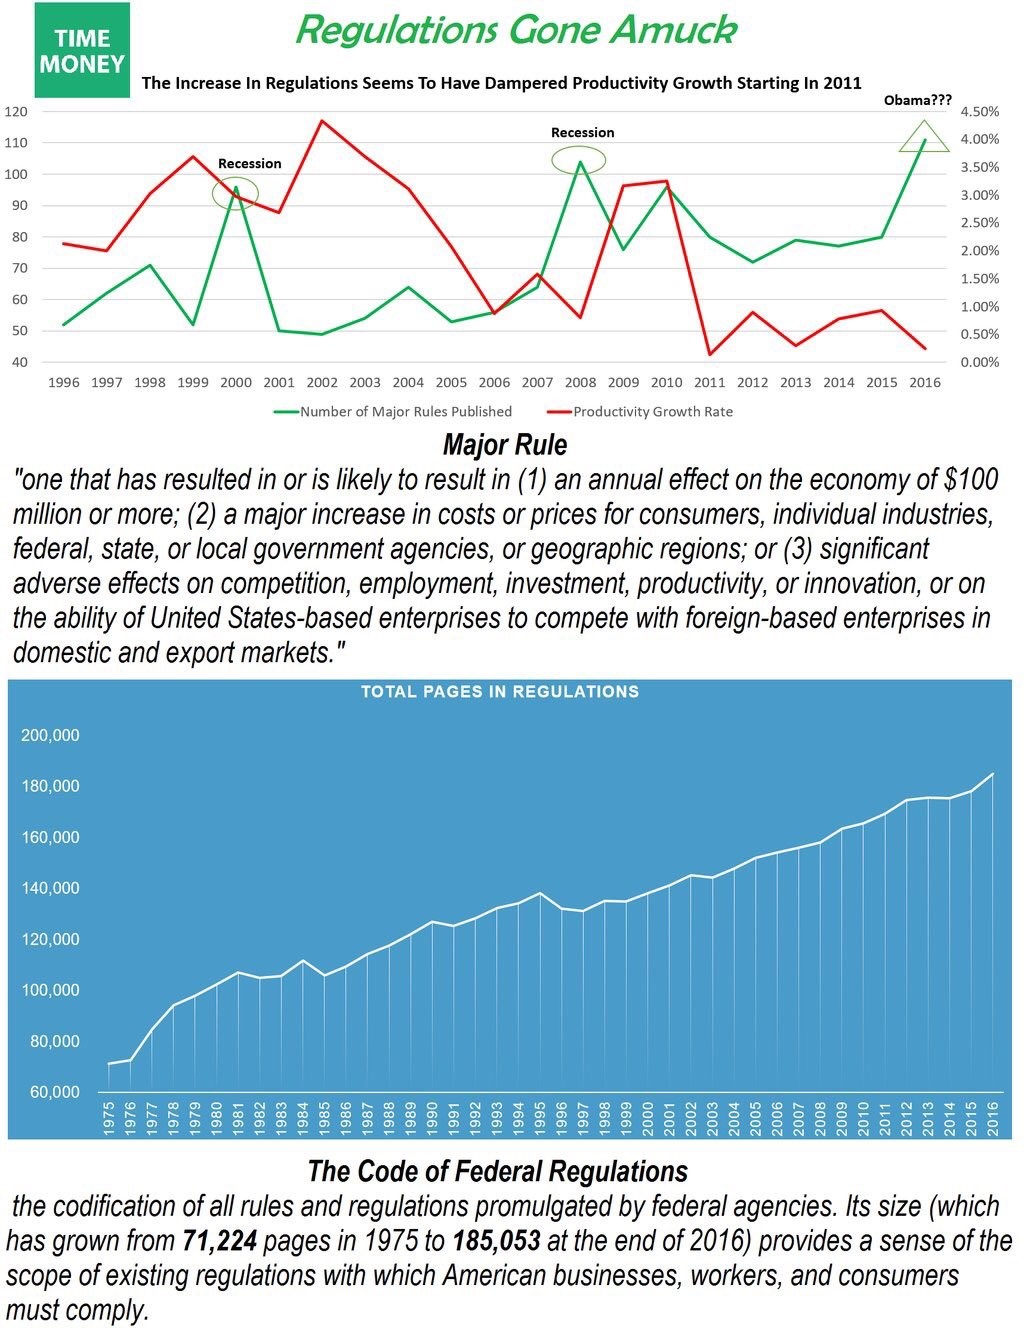
Regulations Hurt Competition
Conclusion
Usually margins are cyclical. However, they have moved higher for S&P 500 firms in the past two cycles because regulations are hurting free market competition. There will likely be a decline in major rules implemented under Trump’s presidency as deregulation was what he campaigned on. Regulations boost stock prices, but they hurt wage growth and standard of living improvements. Sometimes officials get mad that businesses are buying back stock instead of investing in innovation. However, the reason they aren’t growing fixed investment as much as they could is because competition is so low; they don’t have to worry about losing market share. Once again, government policy creates moral hazard and creates larger systemic imbalances, intensifying the risk of prolonged economic corrections. Sooner or later, that will be reflected in stocks.
Have comments? Join the conversation on Twitter.
Disclaimer: The content on this site is for general informational and entertainment purposes only and should not be construed as financial advice. You agree that any decision you make will be based upon an independent investigation by a certified professional. Please read full disclaimer and privacy policy before reading any of our content.


