UPFINA's Mission: The pursuit of truth in finance and economics to form an unbiased view of current events in order to understand human action, its causes and effects. Read about us and our mission here.
Reading Time: 5 minutes
The most interesting part of reviewing the labor market stats is how two analysts can look at the same data and can extrapolate completely different conclusions. We’ll show you the positive and negative theses from the August labor report. First let’s review the headlines. Even in the headlines there is a tail of two cities. The good news is 201,000 jobs were created which beat estimates by 6,000. Average hourly earnings growth was 0.4% month over month and 2.9% year over year. That’s above July’s results which were 0.3% and 2.7%, respectively. Also, weekly earnings growth was 3.2% versus 3% in July.
The bad news is the prior two months were revised to show 50,000 less jobs created, the manufacturing sector lost 3,000 jobs instead of adding 21,000 jobs, the participation rate fell to 62.7% from 62.9%, and the total employed people fell from 162.3 million to 161.8 million. Interestingly, the payrolls number doesn’t include self-employed workers, but the labor force calculation does. The prime age participation rate fell from 82.1% to 82%. Overall, the labor market kept growing, wage growth accelerated, but total workers in the labor market actually fell.
The Negative Thesis
The latest ECRI leading index reading is down 0.2% year over year which signals the economy should be slowing down. The ECRI chart below summarizes the negative stance on the labor market.
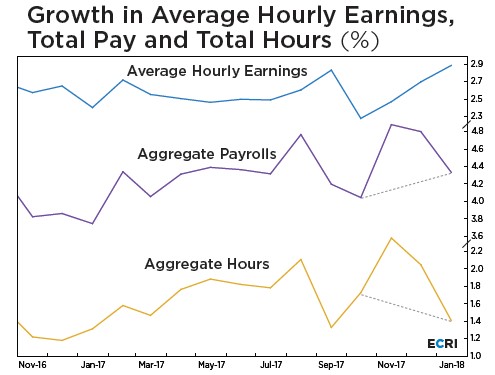
The ECRI chart shows that growth in hours worked is declining while average hourly pay growth is accelerating. Since all that matters is take home pay, this switch leaves us back at square one. It looks worse recently as you can see aggregate payroll growth, shown with the purple line, has decreased.
We see the results differently when looking at average weekly earnings growth which adjusts for hours worked. As we mentioned, weekly earnings growth was 3.2% in August. It is closing in on the expansion peak which is 3.4% which was reached in October 2010 and June 2018.
Real Wage Growth
There’s an opportunity for real wage growth to accelerate in the next few months, reversing the negativity seen this summer. First let’s look at the recent results which aren’t great. The chart below deflates wage growth by core PCE.
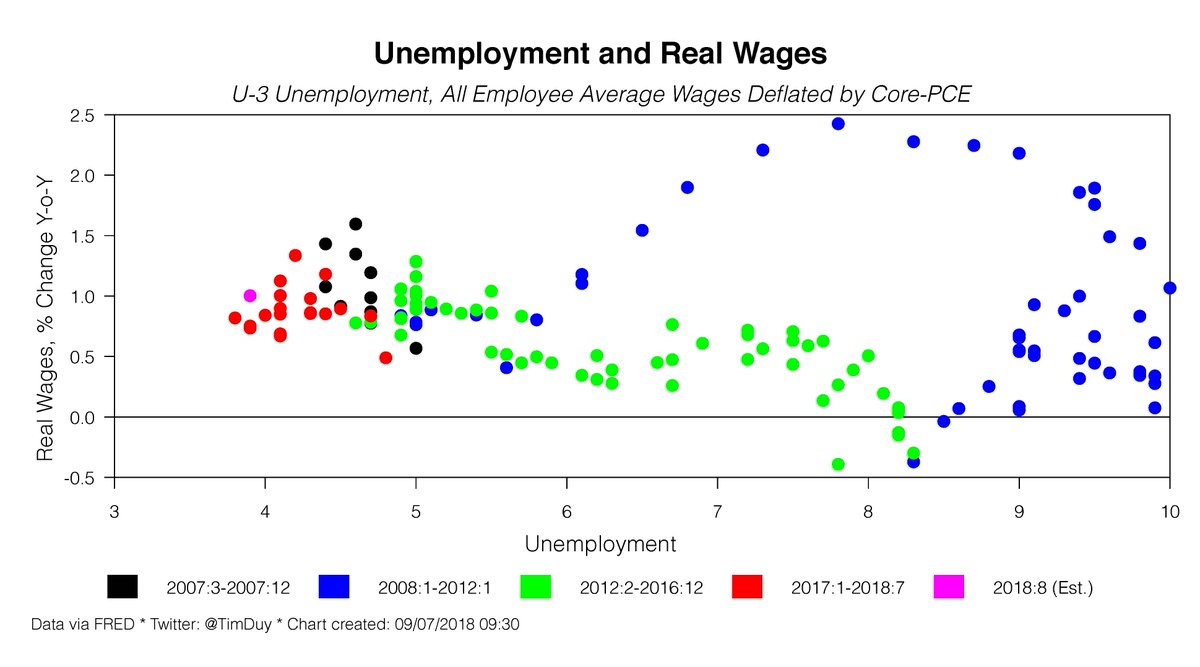
Recently real wage growth is closer to the low end of this cycle. When we say real wage growth was negative in the summer, we’re referring to headline CPI. That explains the difference here. It’s still not great news because the core PCE growth of 2% is the highest since April 2012.
Only looking at one metric to deflate wages is great for headlines, but there’s no reason to avoid looking at the intricacies of the data to better understand it. The chart below shows real hourly earnings growth deflated by core CPI and by core CPI excluding shelter inflation.
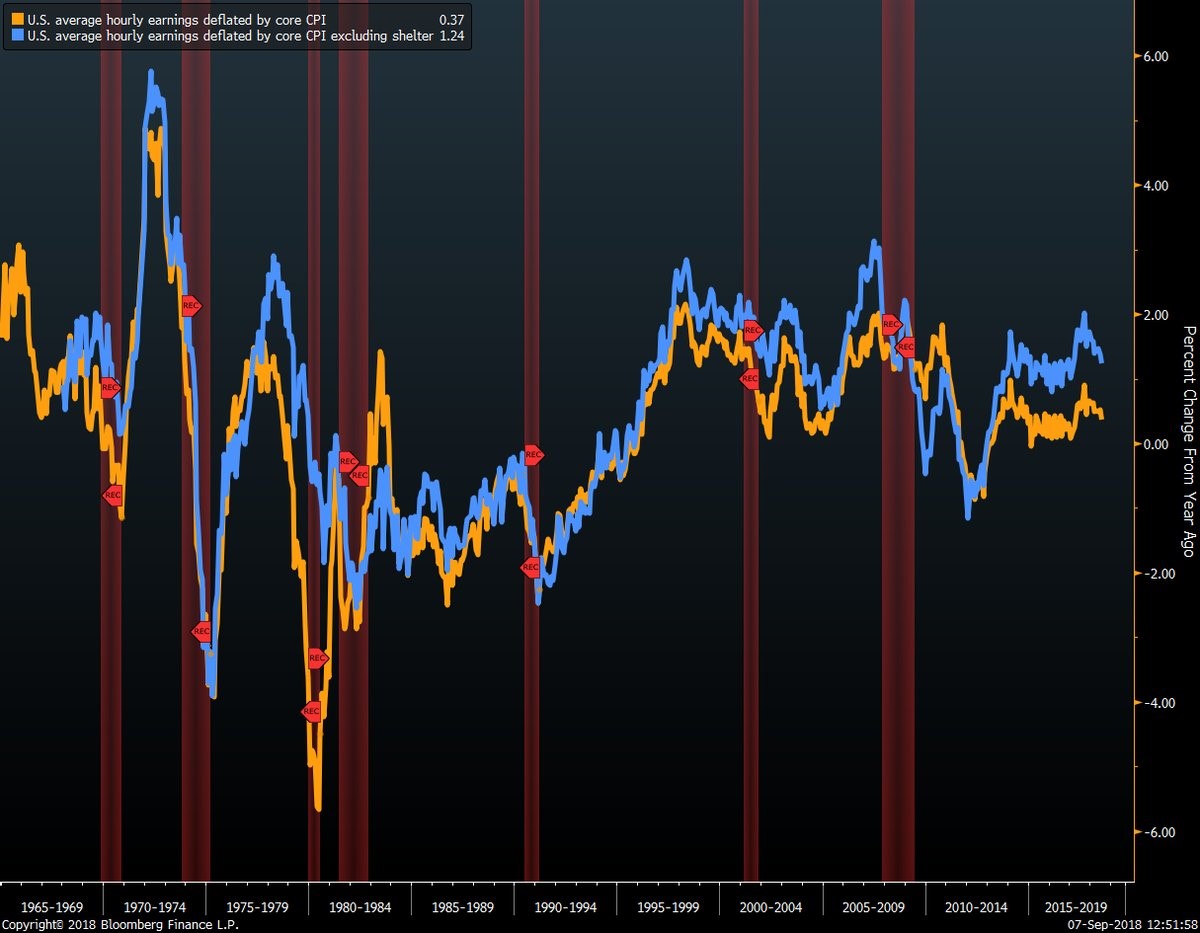
Real wage growth deflated by core CPI is 0.37% and real wage growth deflated by core CPI excluding shelter is 1.24%. As you can see, in the past few decades, both data points have been nearly identical outside of the end of the housing bubble and this cycle. Real wage growth is at the mid-1990s level if you exclude shelter. High rental inflation is hurting workers this cycle as landlords have high pricing power.
Why Real Wage Growth Can Accelerate
As we mentioned, real wage growth could accelerate in the fall and winter. There is a combination of a few factors which could help it. Firstly, the labor market is getting more full as firms in many industries are saying they can’t find workers. This backdrop explains the 3.2% weekly wage growth. There are two other slightly hidden forces.
The first is that year over year inflation growth is set to face tougher comparisons which could mean it decelerates. The exact time the comparison becomes more difficult depends on which inflation metric you follow. For example, core PCE inflation bottomed at 1.4% last August which means August 2018 will be the beginning of the end of easy comparisons. By December 2017, core inflation rose back to 1.6% and by March 2018 it hit 2%. The August CPI report comes out on September 13th. Expectations are for year over year core CPI growth to fall from 2.4% to 2.3% and year over year headline CPI growth to fall from 2.9% to 2.8%.
Another interesting factor is workers were underpaid in Q2. Productivity growth was 2.9% and unit labor costs fell 1%. Output was up 5%, while hours worked were up 2%. Compensation growth was 1.9% which fell from 3.9% in Q1 even though output growth was only 2.6% in Q1. Real compensation growth was 0.5% in Q1 and 0.2% in Q2.
Full Labor Market
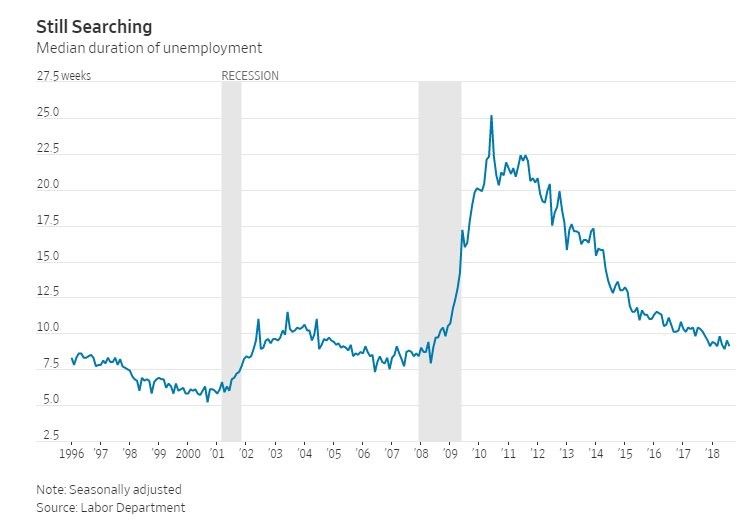
The labor market is nearly filled which means workers have higher bargaining power. The number of jobs available is greater than the number of people looking for work. As you can see from the WSJ chart, the median duration of unemployment is now close to 9 weeks which is near the trough in the last cycle, but still decently above the trough in the cycle before that.
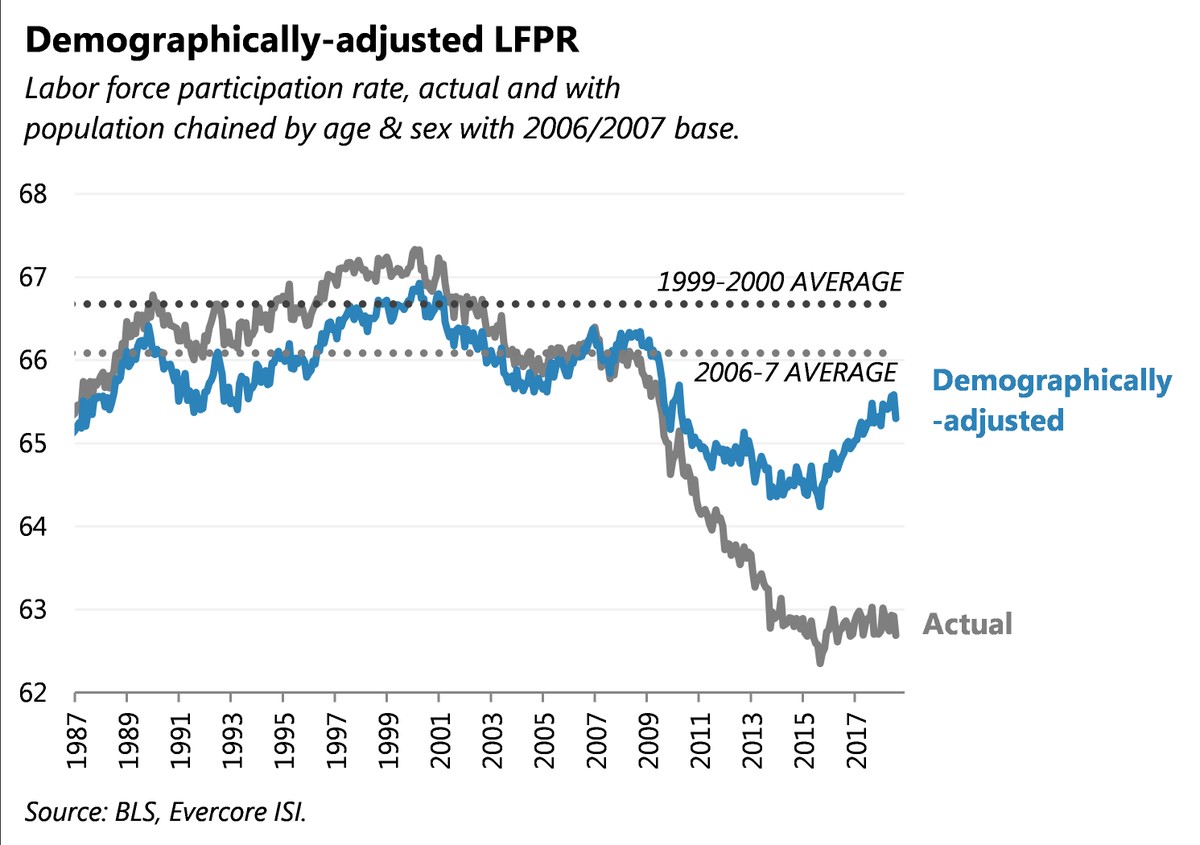
You can’t just look at the overall participation rate and claim the economy hasn’t recovered. Demographics have changed. The prime age labor participation rate peaked at 83.4% last cycle and 84.6% in the cycle before that. The current participation rate is 82% which means we’re near full employment, but there’s a few more quarters left to go in this expansion. The chart below adjusts for changes in age and sex using 2006/2007 as a base. It shows the labor market is slightly below the 2006/2007 average and decently below the 1999-2000 average.
Conclusion
The August labor report shows us the labor market still has slack left. The good news is nominal wage growth is accelerating. Since inflation is expected to fall in the next few months, real wage growth can easily accelerate. While this is potentially good news for the labor market, instead of increasing spending when everything is well, increasing savings may be most prudent, in preparation for the next cyclical downturn.
Have comments? Join the conversation on Twitter.
Disclaimer: The content on this site is for general informational and entertainment purposes only and should not be construed as financial advice. You agree that any decision you make will be based upon an independent investigation by a certified professional. Please read full disclaimer and privacy policy before reading any of our content.


