UPFINA's Mission: The pursuit of truth in finance and economics to form an unbiased view of current events in order to understand human action, its causes and effects. Read about us and our mission here.
Reading Time: 5 minutes
Everyone knows the bull market is 9 years old; it is the longest bull market ever. However, the length of the bull market is largely irrelevant because it came very close to ending. It’s arbitrary to say a bear market is a 20% decline, but not a 19% decline. Returns in cycles are more nuanced because they aren’t subject to arbitrary definitions.
The U.S. stock market’s rolling 10 year returns have been positive 95% of the time in the past 60 years. Looking at global historical returns, America has done well. Investing in US stocks is much different than investing in global stocks. America’s outperformance is partially helped by the poor performance of other countries as capital likes stable nations with consistent rule of law. The fact that the emerging markets are unstable give America a competitive advantage. It’s very difficult to forecast returns for the next few decades because no one knows how governments will act. However, it seems more likely that a stable country will stay that way than the probability of an unstable country becoming stable.
Not Many Declines
The prerequisite understanding that America is unique is important in contextualizing how unusual the performance has been. That doesn’t mean it will or won’t continue. The chart below shows an interesting perspective on historical returns.
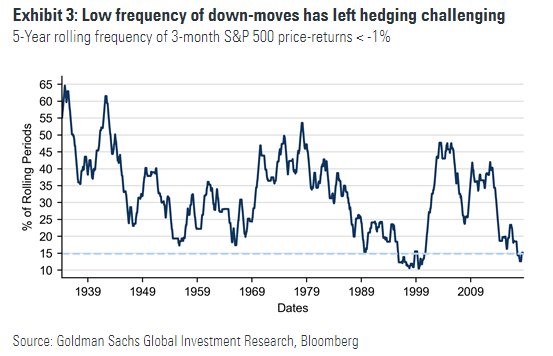
The 5 year rolling frequency of 3 month periods with less than -1% price returns is near the lowest in the past 80 years. Only the late 1990s was a less volatile time for investors. Hedging has been painful in the past 5 years. Short selling has become a lost art because of the long strong bull market which has rarely had sustained negative returns.
Better Returns? It Depends When…
Measuring returns depends on the time frame. There are many ways to review the same data. It’s best to review them all before making a prediction on where stocks will go. For example, the 20 year annual returns of the S&P 500 are 6.9%. Those are nearly the worst returns in history, but 15 and 25 year returns are 9.5% which is near the long term average. Betting that low returns will improve has been a good idea. The chart below shows 15 year trailing annual returns were 3.76% in August 2015. Since then stocks have done well.
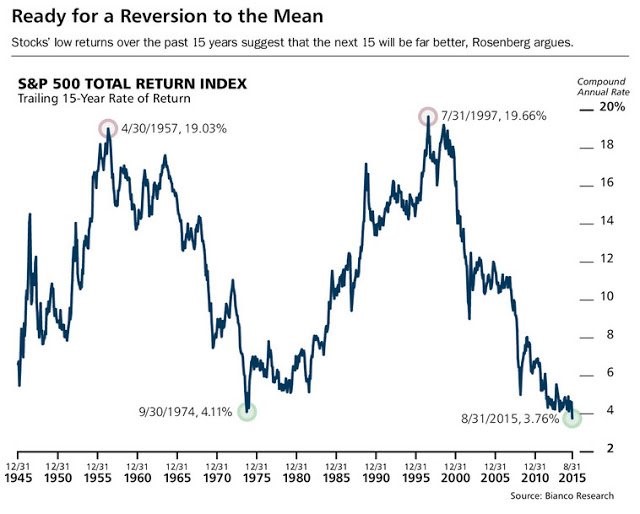
It’s also important to notice the wide swings in returns, showing that buying when returns are weak can be a good idea for a long time if the cycle swings in the opposite direction.
Here’s some more interesting data. Real annual returns from 2000 to 2009 were the worst for any decade heading back until 1880 as stocks fell 3.4% per year.
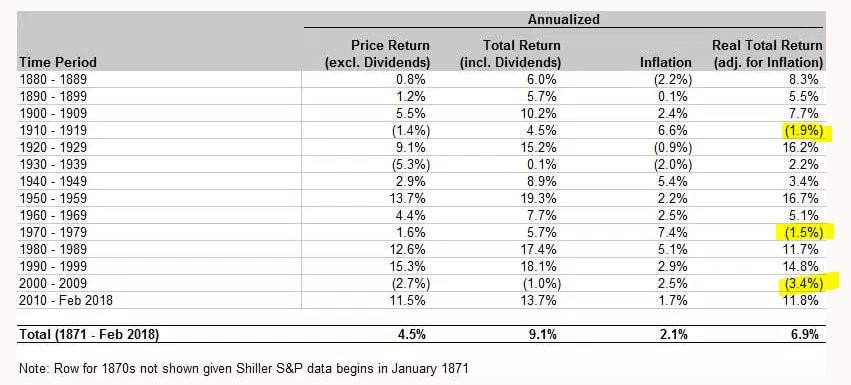
To be clear, rolling data is better than arbitrarily starting at year 0 and ending in year 9. This poor performance implied better returns were coming and they have. In the prior two periods following decades with negative real returns, real returns were 16.2% per year and 11.7% per year. The current average up until February 2018 has been 11.8%.
Household Wealth & Credit
We showed a few variations of historical returns to show how the data can tell bullish and bearish stories if you believe weak returns will follow great returns and great returns will follow weak ones. Now let’s review ways to analyze the household balance sheet.
Inequality has increased and student loan debt has hurt the poor much more than the rich. In 2010, the top 1% in terms of income controlled 36% of global wealth and in 2017 the top 1% controlled 46% of the wealth. It’s debatable if this is a problem because we’d rather see improvement for all groups rather than witnessing the 2008 crisis again.
The chart below shows the student loan debt problem for each income quintile.
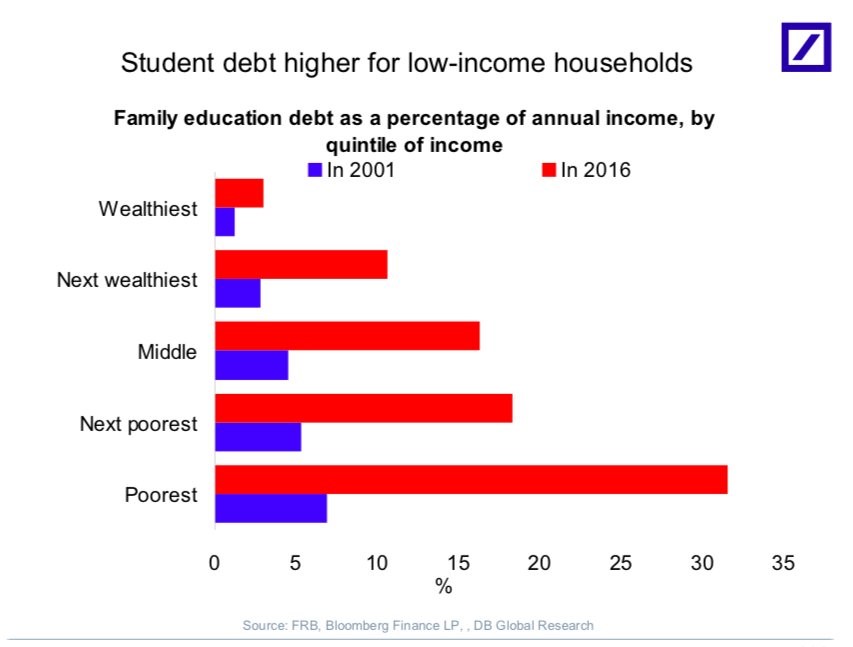
From 2001 to 2016, the bottom quintile has seen student loan debt increase from consuming about 7% of their income to about 32%. The wealthiest quintile only has less than 5% of their income displaced by student loan debt. This is where inequality becomes an issue. It’s relatively fine if the standard of living for the poor is improving slower than the rich, but when there is no progress in standard of living, such as the case with student loan debt becoming a bigger challenge financially, it’s a problem.
The younger generations, specifically millennials, and the poor are being hit disproportionately hard by student loan debt. However, because housing debt is so much larger than credit card and student debt, it’s huge decline this cycle has catalyzed household deleveraging. As you can see in the Bloomberg chart below, household debt to GDP has fallen from above 95% to near 75%.
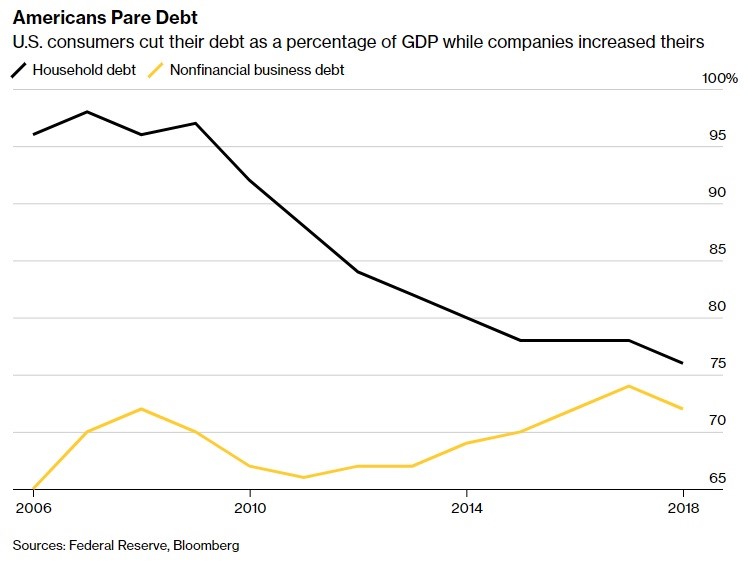
Non-financial business debt is a bit elevated, but the tax cuts and repatriation holiday have helped corporate balance sheets. The repatriation tax holiday worked if the goal was to bring foreign money back to America. It’s fair to wonder how much this helps growth because instead of firms borrowing against their overseas capital to use the money in America, the money is directly coming here. Either way, the money is in America.
As you can see, $300 billion in overseas capital returned to the US in Q1 2018.
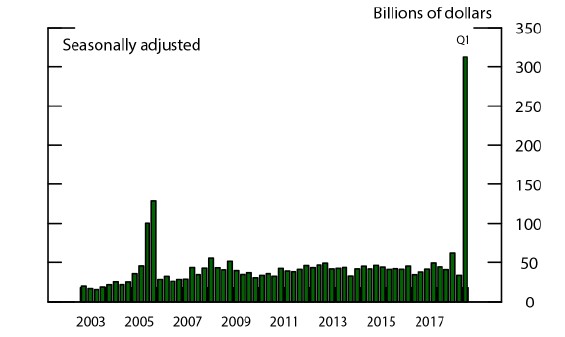
The top 15 overseas cash holders spent $55 billion on buybacks which is up from $23 billion in Q4 2017. It isn’t a problem that the money is used on buybacks because these capital gain profits that go to investors are then invested in other projects, saved, or invested again. It still helps the private economy, indirectly.
Conclusion
In America, stocks have gone up 6.9% per year in real terms. It’s a great market which has historically done well after weak periods. However, poor Americans are still disadvantaged by student loan debt. The bottom quintile doesn’t have much housing debt, so this high debt level means they have excessive leverage. Student debt combined with high rent inflation has created a difficult situation for the poor. On the positive side, overall household debt to GDP is low. Corporate debt to GDP is elevated by the fact that firms are more internationally focused than prior cycles. This means comparing them to U.S. GDP is wrong. The good news is money is being repatriated back to America to pay down debt while also increasing buy backs of stocks, which returns capital indirectly into the private economy.
Have comments? Join the conversation on Twitter.
Disclaimer: The content on this site is for general informational and entertainment purposes only and should not be construed as financial advice. You agree that any decision you make will be based upon an independent investigation by a certified professional. Please read full disclaimer and privacy policy before reading any of our content.


