UPFINA's Mission: The pursuit of truth in finance and economics to form an unbiased view of current events in order to understand human action, its causes and effects. Read about us and our mission here.
Reading Time: 5 minutes
Inflation could be the most important metric to follow because if it gets too high, the Fed will need to accelerate rate hikes which could cause a yield curve inversion and later a recession. One very important thing to keep in mind before we analyze the inflation numbers is the year over year comparisons are weak because inflation was low in 2017. This means inflation accelerating isn’t as impressive as it would be if the comparisons were tougher. Because the business cycle is 9 years old, there is bias to expect sustained core inflation above 2%, but that doesn’t mean it will occur.
Many labor market stats signal there is still enough slack in the labor market to limit wage growth. Oil prices are down 6 straight weeks which is the longest streak in 3 years. Commodity prices are down overall as the Bloomberg Commodities ETF is down 1.65% year to date. That’s not a recipe for inflation to get out of control.
As you can see from the FRED chart below, the 10 year breakeven inflation rate is only 2.11%; this recent range is the highest since September 2014, but is hardly impressive when compared to the rest of the cycle.
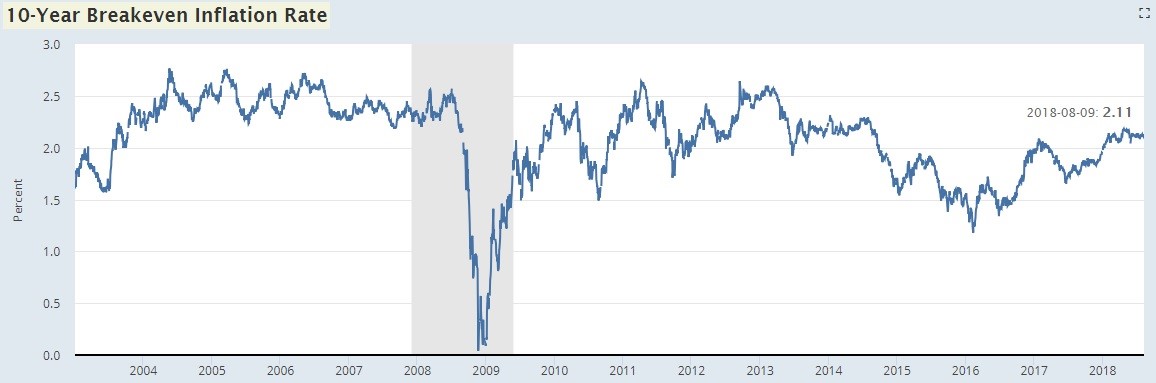
This explains why the 10 year treasury yield can’t stay above 3% for more than a few days. The economy hasn’t made the transition from policy makers and economists wanting more inflation to investors fearing it. One aspect which could get investors and the Fed fearing inflation is a trade war. The tariffs are causing higher prices, but the impact is still very small.
PPI Inflation Disappoints
The PPI inflation measures the prices producers are dealing with which means it is up the supply chain. The CPI measures the end markets as it shows the price pressures consumers face. In theory, this means the PPI is a leading indicator for the CPI, but it doesn’t always work out. Sometimes producers raise prices more than their input costs suggest and sometimes they take margin hits by not passing price increases down to the consumer.
The July PPI report showed headline growth was flat month over month which missed estimates by 0.3% and it was up 3.3% year over year which was 0.1% below the June inflation rate. Usually headline inflation is above core inflation, but this time core inflation increased more as it was up 0.1% month over month. This missed estimates by 0.2%. Core year over year inflation was up 2.7% which was 0.1% below June’s reading. On a month over month basis, headline inflation was driven down by energy and food prices. Energy was down 0.5% month over month. Electric power was down 1.6%, gas was down 0.1%, natural gas was down 0.5%, and heating oil was down 3.9%.
Food prices were down 0.1% month over month. The only category showing inflation accelerating was core inflation which also excludes trade services. It was up 0.3% month over month which beat expectations by 0.1%; it was 2.8% year over year which is acceleration of 0.1% from June. Trade services caused inflation to drop since the number excluding it was strong. It was the first decline in trade service prices since December as lubricants prices fell 12.7% and guestroom rentals rose 3.9%. Final demand prices fell 0.1% which is a negative indicator for CPI.
CPI Comes In As Expected
Even though the PPI report hinted at CPI missing estimates, it mostly met them. As you can see from the chart below, the July year over year headline CPI was 2.9% which met estimates.
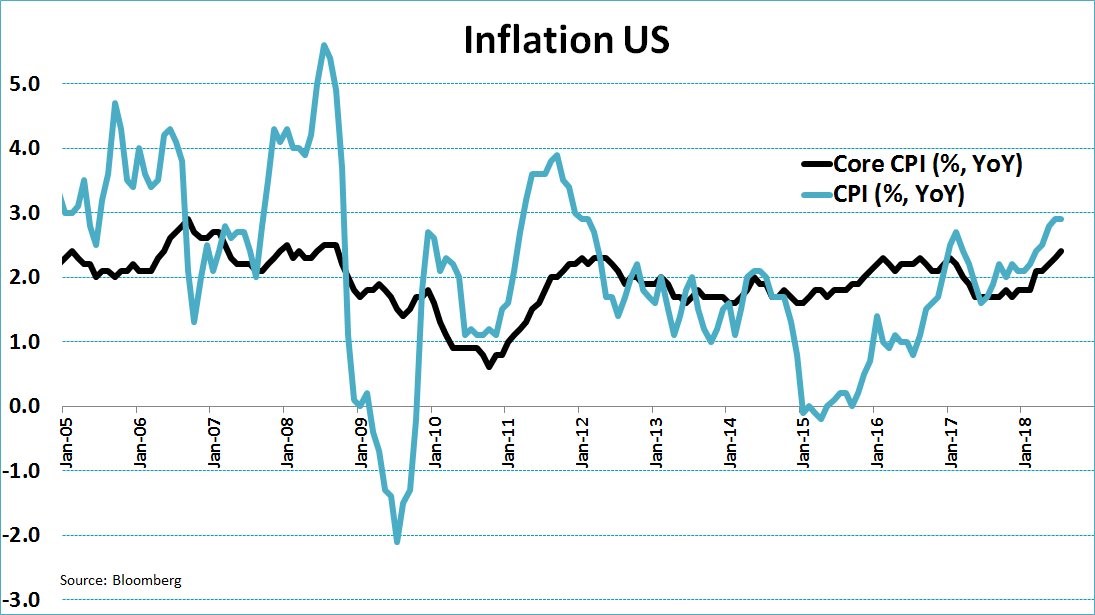
The report also met estimates for month over month inflation of 0.2%. Core inflation was 0.2% month over month which met estimates. There was a big deal made about the year over year core CPI reaching 2.4% which beat estimates for 2.3%. It was a ‘big deal’ because it was the highest print since September 2008.
However, upon inspection, this isn’t a big deal. The rate was 2.354% which means it was half of one basis point away from being rounded down. The previous high this cycle was 2.331% which is just 2 basis points below the July 2018 report, which could easily be revised lower. This inflation rate is built off the easy comparison of just 1.69% in July 2017. Before investors get excited about inflation, recognize that there haven’t been 2 straight years of core CPI being above 2% since 2007 and 2008.
Just like the PPI report, food and energy inflation were weak. Food and beverages were up 0.1% month over month and energy was down 0.5%. Energy was still up 12.1% year over year, explaining why the headline number was above the core inflation rate. The chart below shows prescription drug prices were down 10.9% on an annual rate.
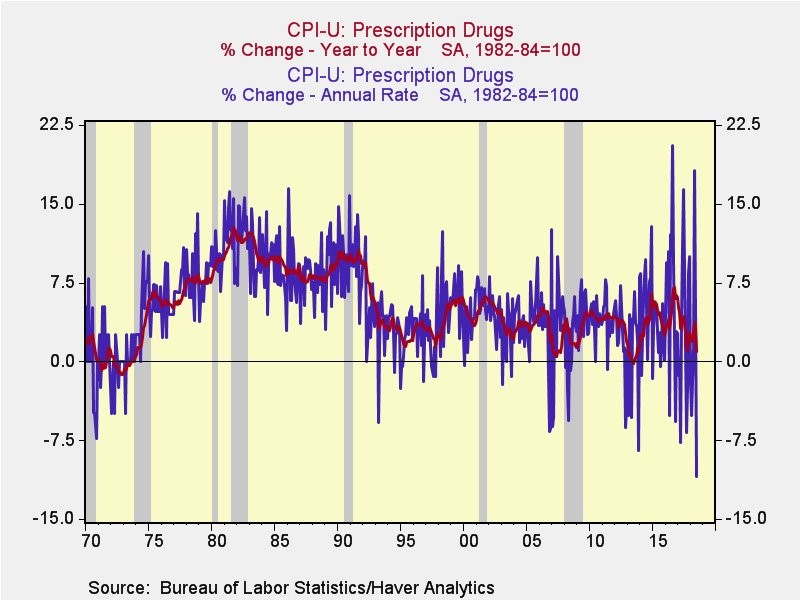
Year over year growth was 0.9% which was the lowest since 2013. Medical care prices overall were down 0.2% month over month and up 1.9% year over year.
The Rent Is Too High
Shelter inflation accounted for almost 60% of headline inflation as it was up 0.3% month over month and 3.5% year over year. Shelter is the consumer’s biggest expense, so its prices changes have an outsized impact on the indexes. Housing prices were up 0.2% and owner’s equivalent rent was up 0.3%, showing prices were up no matter where you live.
The Bloomberg chart below explains how shelter inflation is driving the overall index.
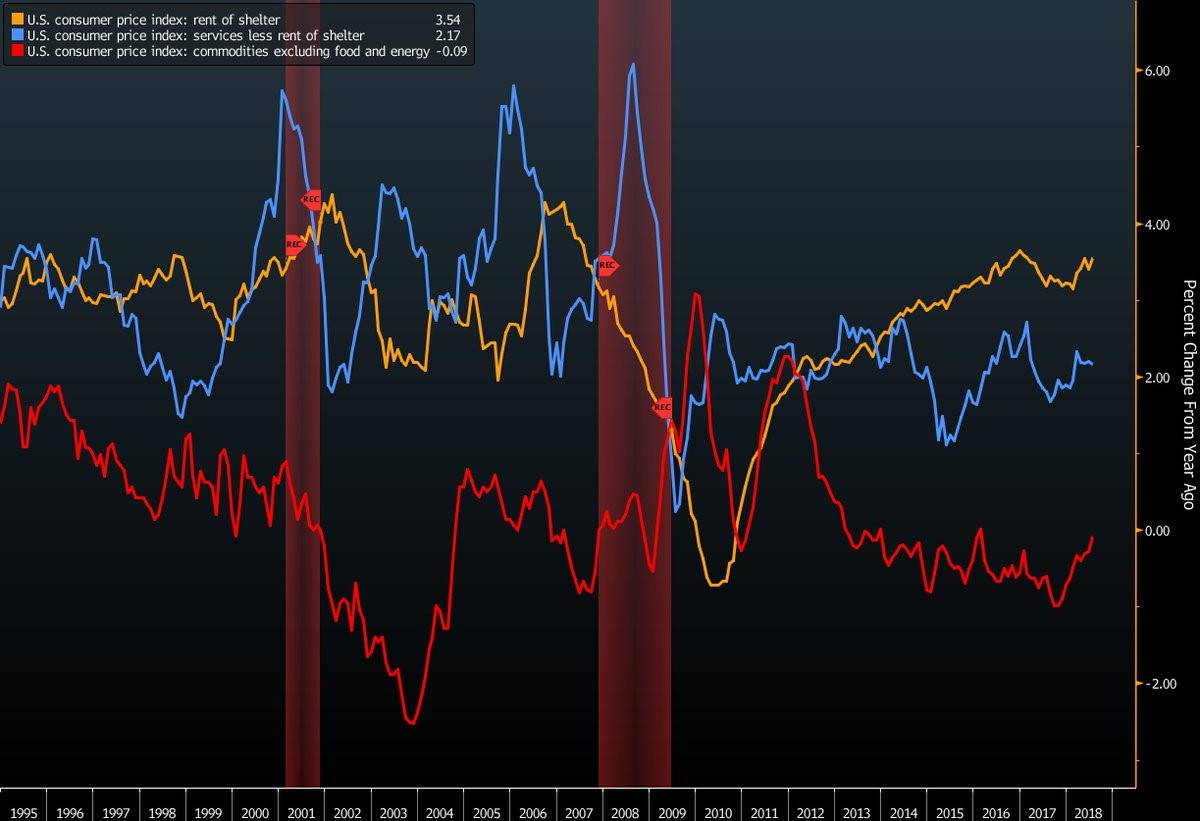
As you can see, rent of shelter is up 3.54%, while services without rent of shelter are only up 2.17%. Commodity prices have been weak since the dollar has been strong. The chart shows commodities excluding food and energy are down 9 basis points.
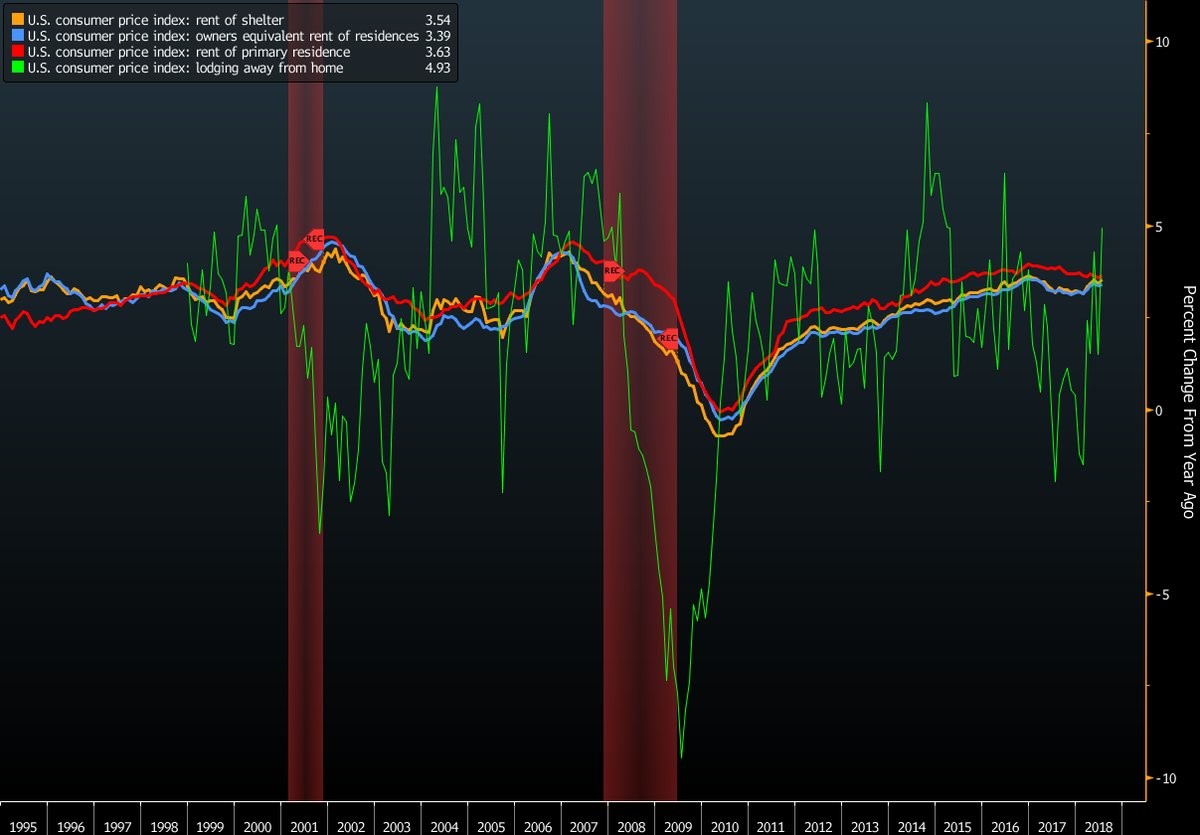
The chart below breaks down shelter inflation further as owner’s equivalent rent of residences was up 3.39%, rent of primary residence was up 3.63%, and lodging away from home was up 4.93%. It’s not surprising to see some weakness in the housing market since shelter inflation is higher than nominal wage growth. Other notable data is transportation prices were up 7.3% year over year, new vehicle prices were up just 0.2%, and used cars and trucks were up 0.8%.
Conclusion
Inflation isn’t problematic if you are a stock investor because it isn’t at the point where it will force the Fed to hike rates quicker. The effect on the consumer depends on if you look at the two year stack of inflation or year over year growth. The two year stack doesn’t show much to worry about because inflation in 2017 was weak. Year over year CPI growth shows there is negative real wage growth.
Have comments? Join the conversation on Twitter.
Disclaimer: The content on this site is for general informational and entertainment purposes only and should not be construed as financial advice. You agree that any decision you make will be based upon an independent investigation by a certified professional. Please read full disclaimer and privacy policy before reading any of our content.


